



26 Axes, One Inflexion and a Number Nobody Puts in the Headline
A fully editable 3-statement model, an equity research report and an investment memo. All three are free to download at the end of this article.
Both the model and the research report are free to download at the end.
Introduction
Here is a number to sit with: ₹89.58. That is Reliance Industries’ weighted average cost per Jio Platforms share, straight from the DRHP. Our triangulated fair value for the same share is ₹1,083, twelve times the promoter’s cost. When Jio lists, that gap becomes one of the largest single wealth creation events in Indian market history. The only question that matters is how much of it is left for the person buying at the Jio IPO.
That question has a surprisingly honest answer, captured in the draft red herring prospectus. What follows is what the filing actually says, what the market narrative gets wrong and where the thesis can break.
Download the Free JIO IPO Financial Model and Research Report
Comprehensive Summary
- What is the Jio IPO: Jio Platforms Limited has filed its Draft Red Herring Prospectus (DRHP) with SEBI on 19 June 2026, formally starting the Jio IPO process. This is the primary source for every figure in this article.
- Jio IPO Date / Launch Date: Not yet officially announced. The Jio IPO date and Jio IPO launch date will be confirmed once SEBI approves the DRHP and the Red Herring Prospectus is filed.
- Jio IPO Price / Price Band: No official Jio IPO price or price band has been declared. The issue price will be set through the book-building process in the RHP.
- Jio IPO Size: The Jio IPO size is a 100% fresh issue of up to 270 million new shares. There is zero Offer for Sale, meaning no existing investor is cashing out.
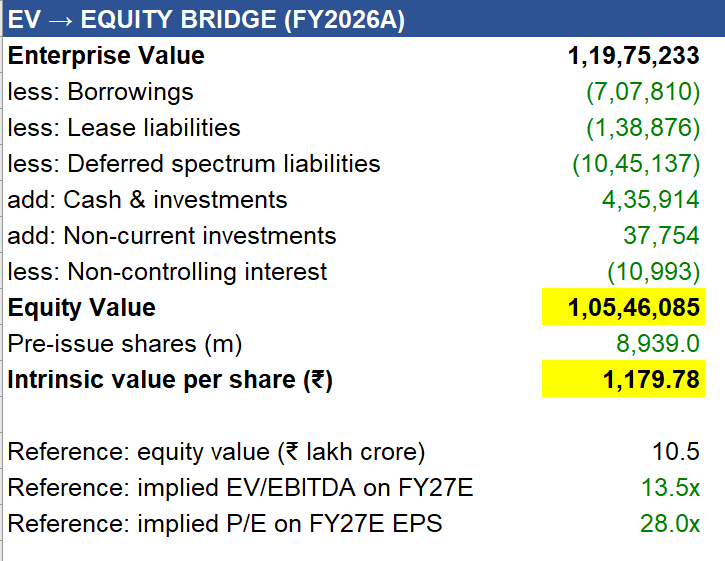
- Jio IPO Valuation: Our triangulated pre-money fair value is ₹1,083 per share, implying an equity value of roughly ₹9.7 lakh crore. The Reliance promoter’s weighted average cost is ₹89.58 per share.
- Jio IPO Shareholder Quota: Reservation details for the Jio IPO shareholder quota (including the Reliance Industries shareholder category) will be disclosed in the RHP.
- Jio IPO GMP / Unlisted Price: No official Grey Market Premium exists yet since the Jio IPO price has not been declared. Jio’s unlisted shares are reportedly trading in the private secondary market at roughly ₹1,250 to ₹1,275 per share. Once active grey market trading begins ahead of listing, you can track the Jio IPO GMP on platforms like Chittorgarh or IPO Watch.
- Jio IPO Expected Date / Listing Exchange: Expected to list on the NSE and BSE. The Jio IPO listing date for listing will be confirmed with the final RHP and price band announcement.
Key Takeaways
- The Reliance Jio IPO is a 100% fresh issue with zero Offer for Sale. Meta, Google, KKR and the entire 2020 investor cohort stay fully invested.
- The expensive decade is over, capex fell from 48.9% to 23.3% of revenue and the free-cash proxy jumped 29x in 24 months; this is the moment the Jio IPO is timed around.
- The DRHP’s 0.36x net leverage figure quietly excludes ₹1.05 lakh crore of deferred spectrum payables, putting them back removes ~₹117 per share from the Jio IPO valuation.
- Promoter cost is ₹89.58, our triangulated Jio IPO valuation is ₹1,083 and the price band, once announced, decides how much of that gap the incoming investor keeps.
Why the Jio IPO Structure Is Unusual: Nobody Is Selling
Nobody is selling. Read that again.
Most Indian mega-IPOs are exits dressed as invitations. The Reliance Jio IPO structurally is not: the issue is 100% fresh, up to 270 million new shares, zero Offer for Sale. Meta (9.98%), Google (7.73%), KKR, PIF, Silver Lake, Vista, Mubadala, General Atlantic, ADIA, TPG, the entire 2020 investor cohort, arguably the most sophisticated register ever assembled around an Indian asset, stay fully invested. Every rupee raised through this Jio IPO goes into the company to prepay operating company debt, where it immediately saves roughly ₹800 crore in interest per ₹10,000 crore prepaid.
The buyer’s money reduces the buyer’s risk. That is the cleanest Reliance Jio IPO architecture that exists.
The Two-Year Swing That Explains the Jio IPO Timing
Why list now? Because the expensive decade just ended. The Jio IPO filing shows it in three data points:
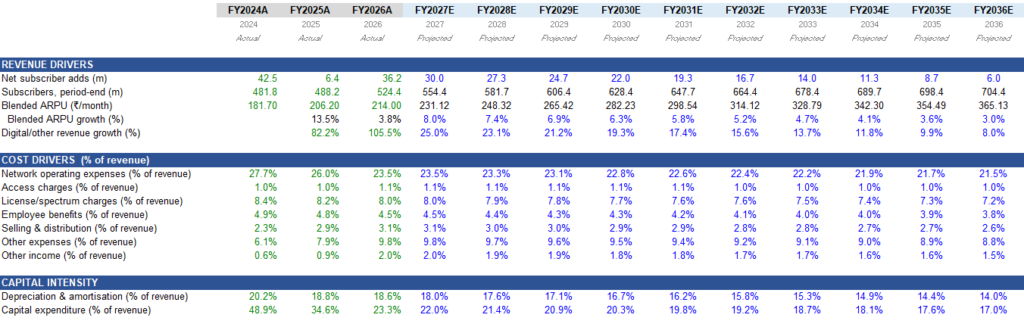
- Capex collapse: Capital expenditure fell from 48.9% of revenue in FY24 to 23.3% in FY26. The pan-India 5G build is done (capital work-in-progress fell from ₹81,177 crore to ₹14,467 crore).
- Pricing repair: The July 2024 tariff hike lifted ARPU from ₹181.7 to ₹214. The subscriber base absorbed it, with net additions recovering from 6.4 million to 36.2 million and churn falling back to 1.67%.
- Free cash inflexion: “EBITDA less cash capex” went from ₹1,449 crore to ₹42,071 crore. Twenty-nine times in twenty-four months.
This is the classic infrastructure moment: the network is built and now it fills. Half a billion subscribers, 42.6% of India’s fixed broadband, 77.5% of 5G fixed wireless (the largest FWA base on earth outside China, built in two years) and 67.6% of every net customer the entire industry added last year.y the most sophisticated register ever assembled around an Indian asset, stays fully invested. Every rupee raised through this Jio IPO goes into the company to prepay operating company debt, where it immediately saves roughly ₹800 crore of interest per ₹10,000 crore prepaid.
The buyer’s money reduces the buyer’s risk. That is the cleanest Reliance Jio IPO architecture that exists.
The two-year swing that explains the timing of Jio IPO
Why list now? Because the expensive decade just ended and the Jio IPO filing shows it in three brutal data points.
- Capital expenditure has collapsed from 48.9% of revenue in FY24 to 23.3% in FY26, the pan-India 5G build is done (capital work-in-progress fell from ₹81,177 crore to ₹14,467 crore).
- The July 2024 tariff hike lifted ARPU from ₹181.7 to ₹214 and the subscriber base absorbed it, with net additions recovering from 6.4 million to 36.2 million and churn falling back to 1.67%.
- And the company’s own free-cash proxy, “EBITDA less cash capex,” went from ₹1,449 crore to ₹42,071 crore. Twenty-nine times, in twenty-four months.
This is the classic infrastructure moment: the network is built and now it fills. Half a billion subscribers, 42.6% of India’s fixed broadband, 77.5% of 5G fixed wireless (the largest FWA base on earth outside China, built in two years) and 67.6% of every net customer the entire industry added last year.
The Jio IPO Valuation Detail Nobody Puts in the Headline
The Jio IPO DRHP proudly reports net leverage of 0.36x, the best balance sheet in global telecom. It is technically true and analytically incomplete. The KPI’s definition leaves out ₹1.05 lakh crore of deferred spectrum payables, debt to the government in every economic sense. Our Jio IPO valuation bridge puts it back, removing about ₹117 per share that a looser model would have manufactured.
Then there is the tax line. Jio paid ₹118 crore of cash tax on ₹40,353 crore of profit before tax, an effective cash rate of nearly 0.3%. Entirely legal (accelerated depreciation and spectrum amortisation), entirely temporary. The shield defers tax rather than eliminating it and the deferred-tax liability (up from ₹21,885 crore to ₹41,210 crore in two years) is the meter running. Our Jio IPO valuation model ramps the cash rate from 4% to the statutory 25.17% by FY33 and that single timing judgement moves the valuation by more than most people’s entire analysis.

The Reliance Jio IPO Thesis: Five Load-Bearing Points
- The capex mountain is behind. CWIP down ₹811,768mn to ₹144,673mn; spectrum-under-development down ₹1,296,020mn to ₹86,114mn. What remains is a built network being filled. Modelled capex fades from 22% of revenue to a 17% floor; this is the assumption to stress-test in diligence.
- Pricing is repairing and the base is held. ARPU ₹181.7 to ₹214.0 in two years; the July 2024 hike cost one year of net-add momentum that fully recovered (36.2m in FY26) with churn back to 1.67%. India remains among the world’s cheapest telecom markets in a disciplined three-player structure.
- Operating leverage is mechanical. Network opex fell 27.7% to 23.5% of revenue while data traffic rose 63%. Margin gap to Bharti India ex-infra is 6.6 points; each point of convergence is roughly ₹15bn of FY27 EBITDA.
- Structure aligns everyone. Zero secondary selling; proceeds deleverage the operating company (₹707,810mn borrowings; every ₹10,000 crore prepaid saves ~₹800 crore of interest); KMP compensation is 0.05% of income; ESOP overhang is 0.11%.
- The TAM is not the constraint. India’s digital economy: ₹49.6tn (FY26) to ₹125.8tn projected FY31; business connectivity revenue pool ₹480-490bn to ₹870-880bn; Jio captured 67.6% of FY26 industry net additions.
Jio IPO Analysis: The DNA Decode Across 26 Axes
Every company we analyse goes through a 26-axis framework. Here is the Jio scorecard:
| Axis | One-line reading | Signal | |
| 1 | Nature of offering | A prepaid digital annuity from half a billion users | Strength |
| 2 | Asset intensity | ₹6.16 lakh cr of assets for ₹1.47 lakh cr of revenue | Watch |
| 3 | Operating model | Integrated owner-operator; single reported segment | Neutral |
| 4 | Customer type | Mass B2C + barely-penetrated enterprise option | Strength |
| 5 | Revenue predictability | 1.67% churn; cash arrives before service is rendered | Strength |
| 6 | Pricing power | Real, but collective, a three-player repair cycle | Strength |
| 7 | Cost structure | Network opex 27.7% to 23.5% of revenue while traffic rose 63% | Strength |
| 8 | Capital dependence | Past the mountain: capex 48.9% to 23.3% | Improving |
| 9 | Regulatory exposure | ~8% of revenue is licence/SUC before spectrum is even bought | Watch |
| 10 | Geographic exposure | 100% India, undiluted, both ways | Watch |
| 11 | Business lifecycle | Maturing cash machine with a free-option attic (AI/digital) | Neutral |
| 12 | Ownership | RIL 66.43% + Meta/Google/PE/SWF register; nobody exiting | Strength |
| 13 | Listing status | Fresh-only issue, structure as an alignment signal | Strength |
| 14 | Tech intensity | 100MHz+ contiguous C-band everywhere; 5G-SA slicing | Strength |
| 15 | Management style | Promoter-led strategy, professional execution | Neutral |
| 16 | Digital maturity | 42.3 GB/user/month, world’s most intensively used network | Strength |
| 17 | Peer benchmarking | 6.6-point EBITDA-margin gap to Bharti = the upside map | Gap |
| 18 | Unit economics | ARPU ₹214 vs Bharti mobile ₹257, visible repair runway | Strength |
| 19 | Valuation anchor | DCF-led triangulation: ₹1,083/share pre-money | Anchor |
| 20 | ESOP dilution | ~0.11% overhang. Rounding error. | Strength |
| 21 | Structural risk | Spectrum cycles, satellite entrants, related-party lattice | Watch |
| 22 | Industry TAM | Digital economy ₹49.6tn to ₹125.8tn by FY31 | Strength |
| 23 | Return ratios | ROACE 10.8% vs WACC 10.1%, the whole Jio IPO is this bet | Watch |
| 24 | Crisis handling | Was the disruptor, absorbed its own FY25 shock in 4 quarters | Strength |
| 25 | Pay vs shareholders | KMP compensation = 0.05% of income. Nothing leaks. | Strength |
| 26 | Proceeds utilisation | All primary, all deleveraging | Strength |
Sixteen strengths, six watch-points, three neutrals, one anchor. But read axis 23 twice, because it is where the entire Reliance Jio IPO lives: today, Jio earns almost exactly its cost of capital. Weighted return on net worth is 9.04%; return on capital employed is 10.76%; our WACC is 10.13%. Everything the bulls believe is a bet that returns are about to inflect above that line. Everything the Bears believe is that they won’t.
Jio IPO Valuation: What Is It Actually Worth?
Three methods were used to triangulate the Jio IPO valuation:
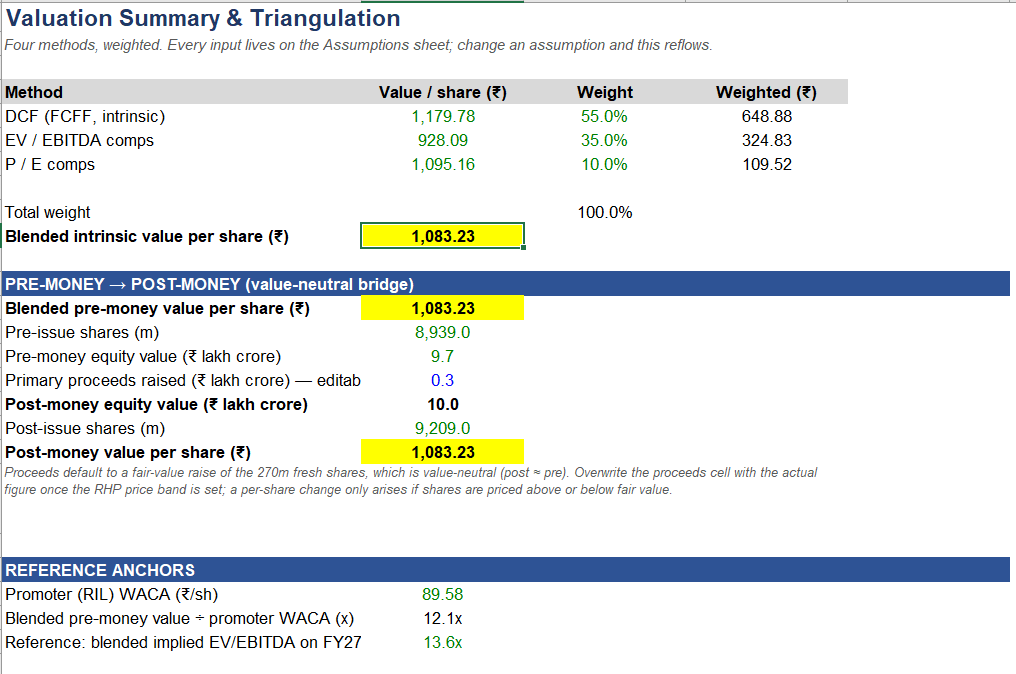
- Cash-tax DCF (55% weight): ₹1,180/share
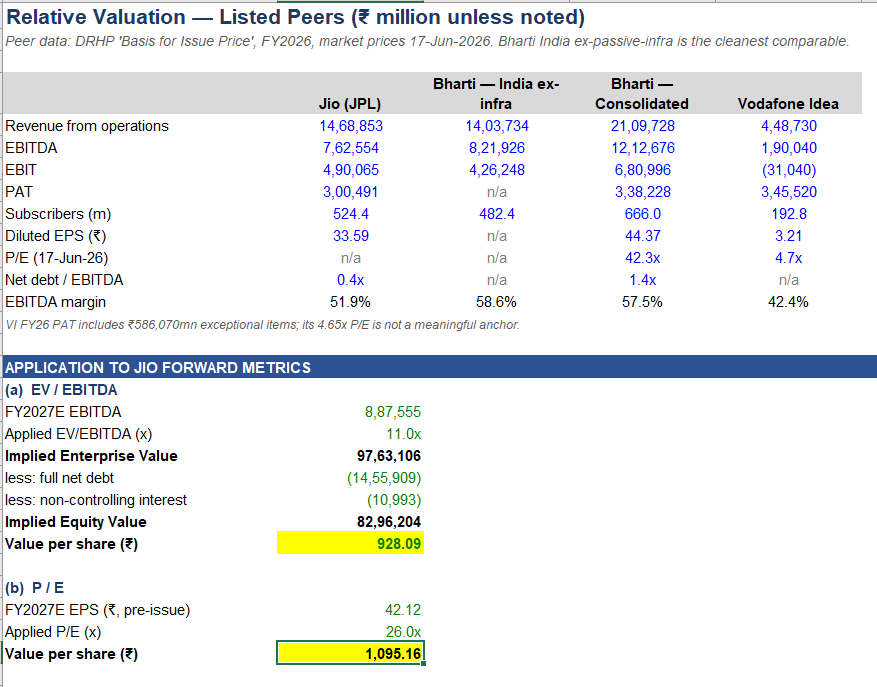
- Forward EV/EBITDA comps anchored to Bharti’s India business (35% weight): ₹928/share
- Forward P/E cross-check (10% weight): ₹1,095/share.
| Metric | Figure |
| Blended pre-money fair value | ₹1,083 per share |
| Implied equity value | ₹9.7 lakh crore |
| Implied FY27E EV/EBITDA | 13.5x (Bharti India: ~9–11x) |
| DCF sensitivity band (WACC 9.5–12%, g 3–5%) | ₹781 – ₹1,571 |
| If priced at ₹900 / ₹1,000 / ₹1,200 | +20% / +8% / -10% vs fair value |
Yes, that is a two-to-three-turn premium to Bharti. We priced faster growth, a rising margin, the sector’s best balance sheet and a digital/AI layer carried at cash flow rather than at a story multiple and we wrote the premium down as the debate you must own, not a fact you should accept. The bear case fits in one sentence: if capex doesn’t normalise or pricing discipline breaks, this is a utility at a growth multiple.
2. Pricing is repairing and the base held. ARPU ₹181.7 → ₹214.0 in two years; the July 2024 hike cost one year of net-add momentum (6.4m) that fully recovered (36.2m in FY26) with churn back to 1.67%. India remains among the world’s cheapest telecom markets in a disciplined three-player structure, the repair cycle has runway.
3. Operating leverage is mechanical. Network opex fell 27.7% → 23.5% of revenue while data traffic rose 63%. Margin gap to Bharti India ex-infra is 6.6 points, each point of convergence ₹15bn of FY27 EBITDA. Our forecast closes only two-thirds of the gap by FY36 and still yields 14% EBITDA CAGR to FY31.
4. Structure aligns everyone. Zero secondary selling; proceeds deleverage the operating company (₹707,810mn borrowings; every ₹10,000 cr prepaid saves ≈₹800 cr of interest at the 8% borrowing cost); KMP compensation is 0.05% of income; ESOP overhang 0.11%. Promoter WACA of ₹89.58 contextualises, alignment, not exit.
5. The TAM is not the constraint. India’s digital economy: ₹49.6tn (FY26) → ₹125.8tn projected FY31; business connectivity revenue pool ₹480–490bn → ₹870–880bn; Jio captured 67.6% of FY26 industry net additions. The company is the industry’s growth engine per the Jio IPO filing’s own market data.
The DNA decode: 26 axes, one verdict for Jio IPO Price
We read every company through a 26-axis framework, the structured way an underwriter interrogates a business, from the nature of its revenue to how management is paid. Here is the Jio scorecard; the full evidence behind every line is in the downloadable report.
| # | Axis | One-line reading | Signal |
| 1 | Nature of offering | A prepaid digital annuity from half a billion users | Strength |
| 2 | Asset intensity | ₹6.16 lakh cr of assets for ₹1.47 lakh cr of revenue | Watch |
| 3 | Operating model | Integrated owner-operator; single reported segment | Neutral |
| 4 | Customer type | Mass B2C + a barely-penetrated enterprise option | Strength |
| 5 | Revenue predictability | 1.67% churn; cash arrives before service is rendered | Strength |
| 6 | Pricing power | Real, but collective, a three-player repair cycle | Strength |
| 7 | Cost structure | Network opex 27.7% → 23.5% of revenue while traffic rose 63% | Strength |
| 8 | Capital dependence | Past the mountain: capex 48.9% → 23.3% | Improving |
| 9 | Regulatory exposure | ~8% of revenue is licence/SUC before spectrum is even bought | Watch |
| 10 | Geographic exposure | 100% India, undiluted, both ways | Watch |
| 11 | Business lifecycle | Maturing cash machine with a free-option attic (AI/digital) | Neutral |
| 12 | Ownership | RIL 66.43% + Meta/Google/PE/SWF register; nobody exiting | Strength |
| 13 | Listing status | Fresh-only issue, structure as alignment signal | Strength |
| 14 | Tech intensity | 100MHz+ contiguous C-band everywhere; 5G-SA slicing | Strength |
| 15 | Management style | Promoter-led strategy, professional execution | Neutral |
| 16 | Digital maturity | 42.3 GB/user/month, the world’s most intensively used network | Strength |
| 17 | Peer benchmarking | 6.6-point EBITDA-margin gap to Bharti = the upside map | Gap |
| 18 | Unit economics | ARPU ₹214 vs Bharti mobile ₹257, visible repair runway | Strength |
| 19 | Valuation anchor | DCF-led triangulation: ₹1,083/share pre-money | Anchor |
| 20 | ESOP dilution | ~0.11% overhang. Rounding error | Strength |
| 21 | Structural risk | Spectrum cycles, satellite entrants, related-party lattice | Watch |
| 22 | Industry TAM | Digital economy ₹49.6tn → ₹125.8tn by FY31P | Strength |
| 23 | Return ratios | ROACE 10.8% vs WACC 10.1%, the whole Jio IPO is this bet | Watch |
| 24 | Crisis handling | Was the disruptor; absorbed its own FY25 shock in 4 quarters | Strength |
| 25 | Pay vs shareholders | KMP compensation = 0.05% of income. Nothing leaks | Strength |
| 26 | Proceeds utilisation | All primary, all deleveraging | Strength |
Sixteen strengths, six watch-points, three neutrals, one anchor. But read axis 23 twice, because it is where the entire Reliance Jio IPO lives: today, Jio earns almost exactly its cost of capital. Weighted return on net worth is 9.04%; return on capital employed is 10.76%; our WACC is 10.13%. A decade of spectrum and steel sits on the balance sheet ahead of the revenue it will carry. Everything the bulls believe, 13% revenue compounding, margins gliding from 51.9% toward the mid-50s, capex settling at maintenance, is a bet that returns are about to inflect above that line. Everything the bears believe is that they won’t.
So what is it worth?
We built a fully formula-driven three-statement model; income statement, balance sheet and cash flow that articulate to the rupee, with every historical driver computed from the Jio IPO DRHP and every forward driver an editable input beside it. On top of it, used three methods to get the intrinsic value for Jio IPO price: a cash-tax DCF (55% weight, ₹1,180/share), forward EV/EBITDA comps anchored to Bharti’s India business (35%, ₹928) and a forward P/E cross-check (10%, ₹1,095).
| Blended pre-money fair value | ₹1,083 per share |
| Implied equity value | ₹9.7 lakh crore |
| Implied FY27E EV/EBITDA | 13.5x (Bharti India: ~9–11x) |
| DCF sensitivity band (WACC 9.5–12%, g 3–5%) | ₹781 – ₹1,571 |
| If priced at ₹900 / ₹1,000 / ₹1,200 | +20% / +8% / −10% vs fair value |
Yes, that is a two-to-three-turn premium to Bharti. We did not reverse-engineer it away, we priced faster growth, a rising margin, the sector’s best balance sheet and a digital/AI layer carried at cash flow rather than at a story multiple and we wrote the premium down as the debate you must own, not a fact you should accept. The bear case fits in one sentence: if capex doesn’t normalise or pricing discipline breaks, this is a utility at a growth multiple.
Download the Jio IPO Model, Research Report and Investment Memo (Free)
- The Jio IPO Valuation Model (Excel): Integrated 3-statement engine, FY27 to FY36, one Assumptions sheet where history is computed and the future is yours to type. Change the capex floor, the ARPU path or the tax ramp and watch the Jio IPO valuation reprice live.
- The Equity Research Report on Jio IPO: The full 26-axis decode with DRHP evidence behind every scorecard line, the complete valuation build and the risk map.
- The Investment Memo on Jio IPO: Five load-bearing thesis points, the entry-math grid the Jio IPO price band will slot straight into and the three triggers that would change our mind.
The promoter’s cost is ₹89.58. Fair value is ₹1,083. The Jio IPO price band decides who keeps the difference. Download the model and be ready before it prints.
Download the Free JIO IPO Financial Model and Research Report
Jio IPO: Frequently Asked Questions
Is the Jio IPO a good investment?
Depends entirely on the Jio IPO price. Our fair value is ₹1,083 per share; entry below that gives you a margin of safety; entry above means you’re paying for a business still earning close to its cost of capital today.
How do institutional investors evaluate the Jio IPO?
They triangulate: a cash-tax-adjusted DCF, EV/EBITDA multiples benchmarked against Bharti and a P/E cross-check, then stress-test the capex path, ARPU repair, tax-shield unwind and the deferred spectrum liability the Reliance Jio IPO DRHP’s headline leverage figure quietly excludes.
How do you analyse the Jio IPO like an investment banker?
Build a clean three-statement model from the Jio IPO DRHP, run a cash-tax DCF (not an EBITDA shortcut), include deferred spectrum liabilities in the bridge, triangulate across three methods and express the Jio IPO valuation as a range, not a single number.
How can you build a financial model for the Jio IPO?
Download our free Jio IPO model: a three-statement engine (FY27–FY36) where every historical figure is computed from the DRHP and every forward input is editable. Change the capex floor or ARPU path and the Jio IPO valuation reprices live.
How do you write an equity research report on the Jio IPO?
Cover six things: business model, unit economics, capital structure (including the liabilities the headline Jio IPO DRHP KPI skips), multi-method valuation, risk framework and a clear conclusion tied to a specific Jio IPO price entry point.
What is Jio’s debt-to-equity ratio?
The Reliance Jio IPO DRHP reports net debt-to-EBITDA of 0.36x, but this excludes ₹1.05 lakh crore of deferred spectrum payables. Include them and the true leverage picture looks materially different.
Disclaimer
This article and the accompanying model, report and memo are for educational and informational purposes only. They are NOT investment advice, NOT a recommendation or solicitation to buy, sell or subscribe to any security, including the Jio IPO.
The author is not a SEBI-registered investment adviser or research analyst and nothing here should be relied upon as personalised financial, legal or tax advice.
The Jio IPO price band has not been announced. The issue price will be determined by the book-building process described in the RHP. Any prices referenced are assumptions or third-party/grey-market observations, not official figures and may be wrong.
The valuation outputs depend on assumptions that may not hold. Small changes in growth, discount rate or exit multiple can change the conclusions materially. The fair value range is a judgement, not a fact.
Historical figures are drawn from the publicly filed DRHP; forward estimates are the author’s own and are inherently uncertain.
Past performance and grey market prices are not indicative of future results. Markets can and do fall. You can lose money.
Do your own research and consult a SEBI-registered investment adviser before making any investment decision. You are solely responsible for your own choices.
Analytical and educational content based on the Jio Platforms Limited DRHP dated June 19, 2026 and a proprietary model; FY27E–FY36E figures are estimates.