CFA Level 1 : Quantitative Methods
1. Rates and Returns / Time Value of Money
Interest Rate Components
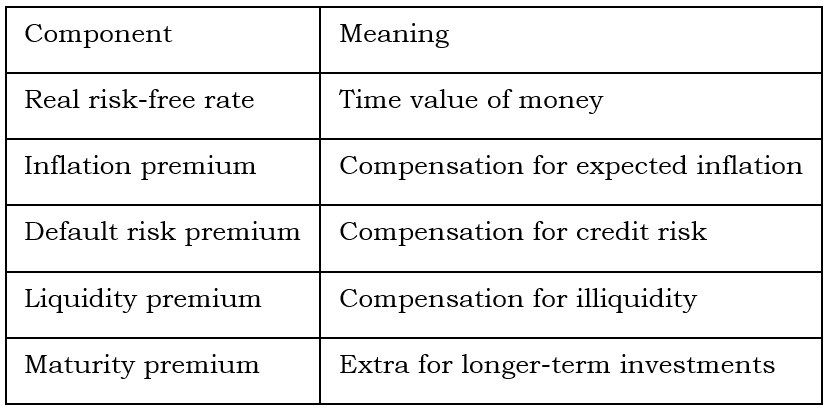
Formula:
Nominal Rate = Real risk-free rate + Inflation premium + default risk premium +Liquidity premium + maturity premium

Interest Rate Structure Diagram
Time Value of Money (TVM)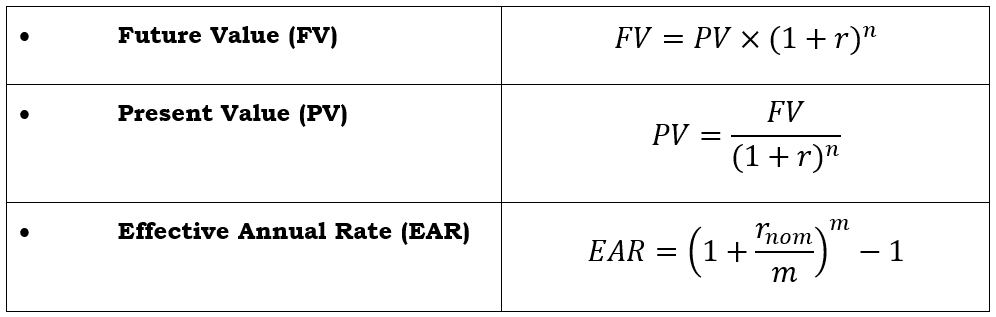

Timeline for TVM Problems
Annuities and Perpetuities
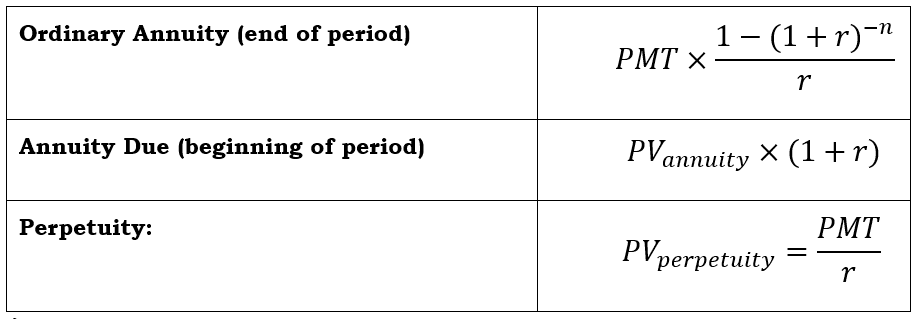
Annuity:
Ordinary Annuity: Payments occur at the end of each period (most common in loans, bonds).
Annuity Due: Payments occur at the beginning of each period (e.g., rent).
Perpetuity: Payment for infinite life
2.Statistical Concepts and Market Returns
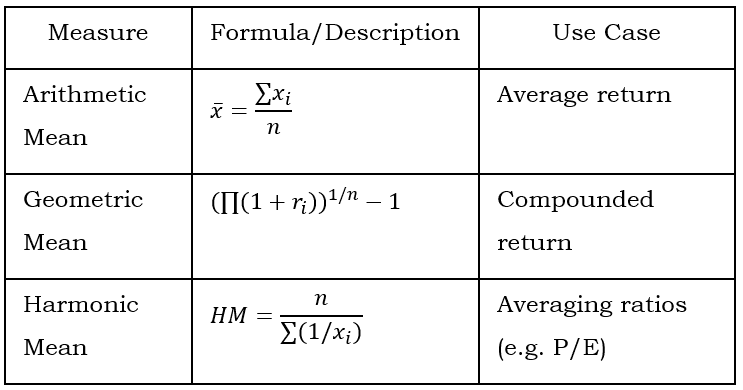
Measures of Central Tendency
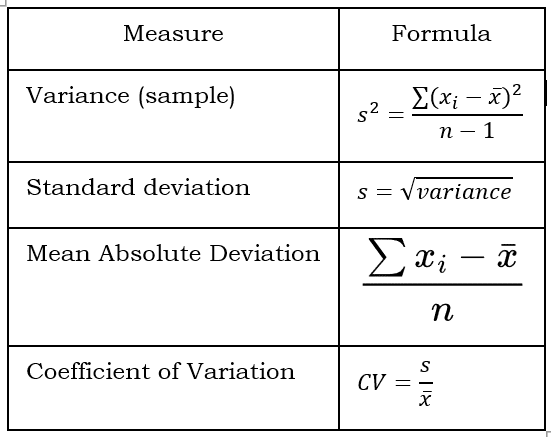
Measures of Dispersion
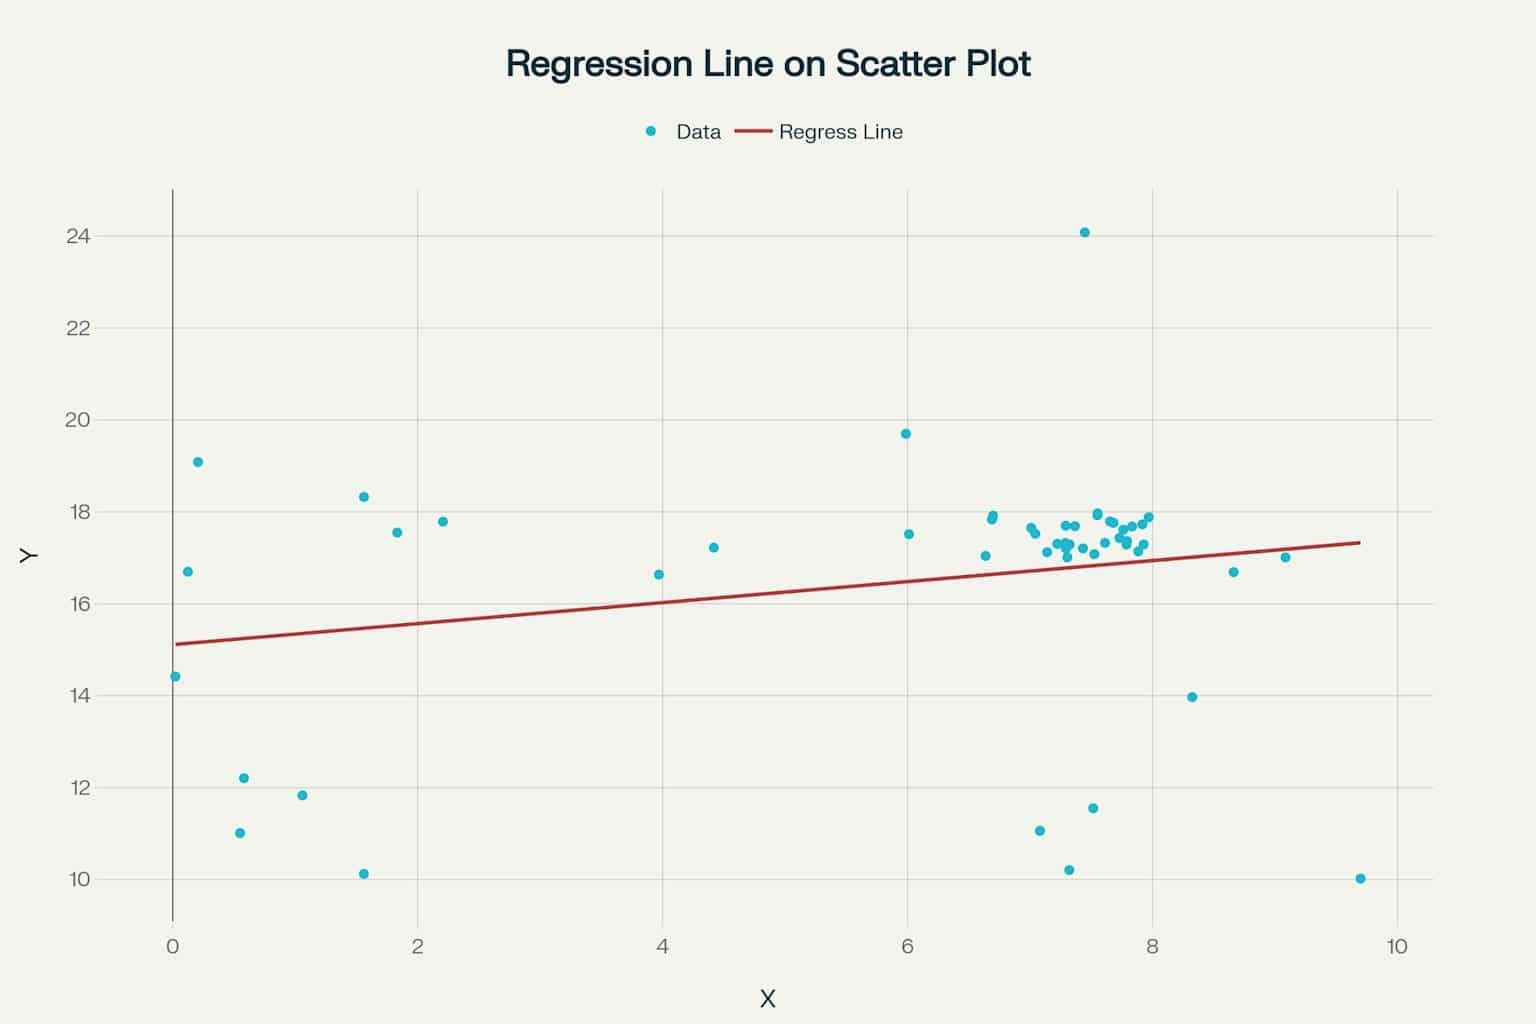
3. Organizing, Visualizing, and Describing Data
Graphical Tools
- Histogram: Visualizes frequency distribution.
- Boxplot: Shows median, quartiles, outliers.
- Scatter Plot: Reveals correlation between two variables.
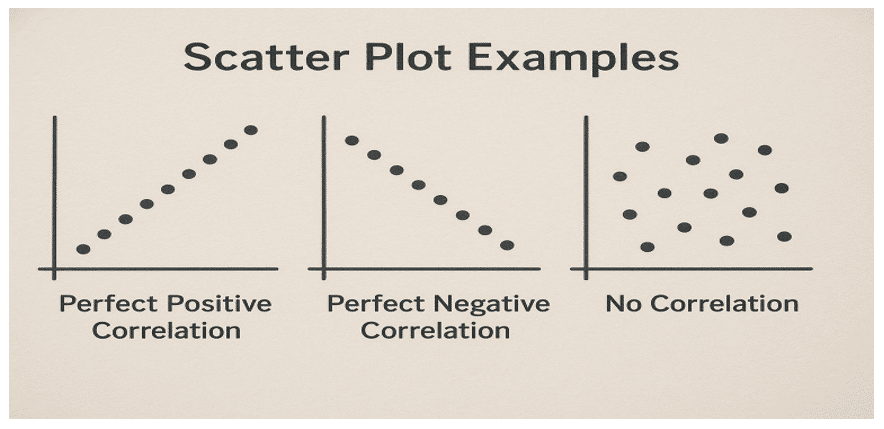
Scatter Plot Examples
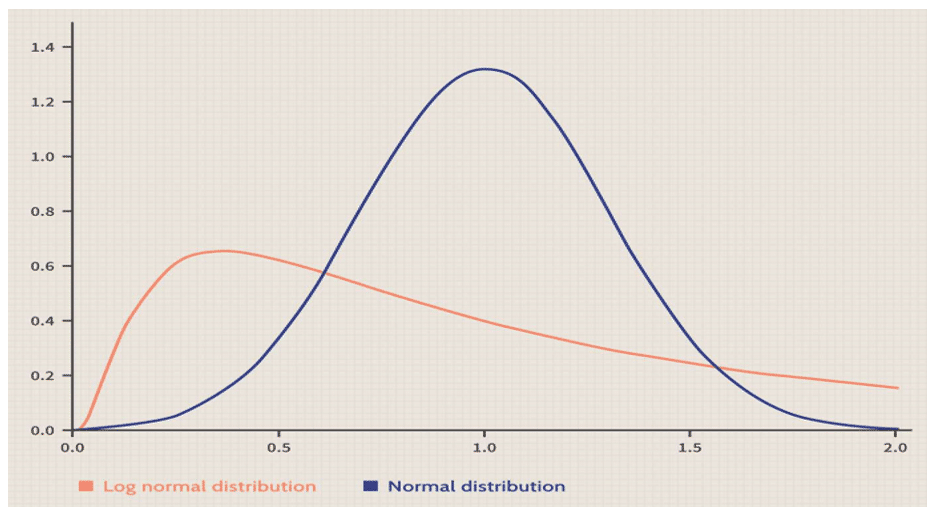
Log-normal vs Normal Distribution
4. Probability Concepts and Distributions
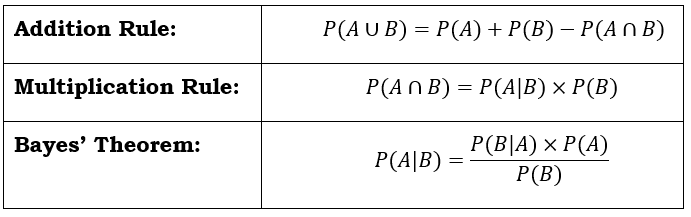
Probability Rules
Distributions
- Discrete: Binomial, Poisson
- Continuous: Normal, lognormal, uniform
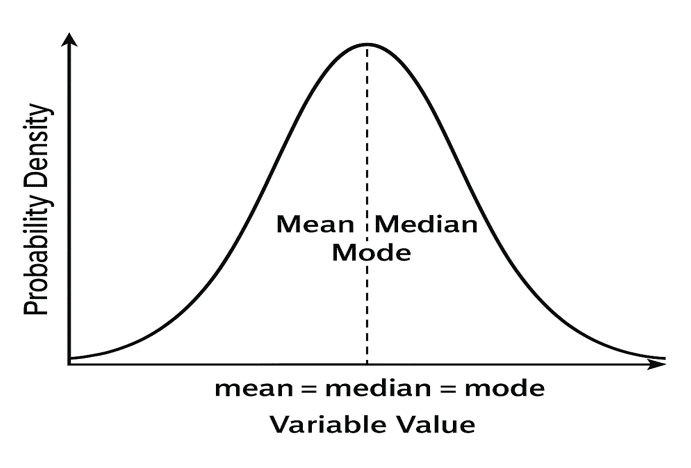
Normal Distribution Curve
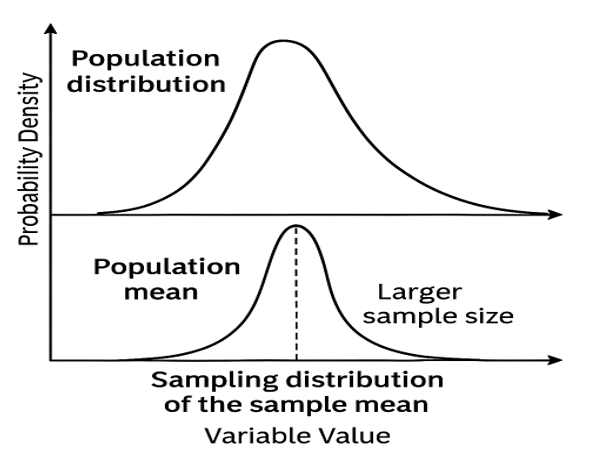
5. Sampling and Estimation
- Sampling Methods: Simple random, stratified, cluster, convenience, judgmental.
- Central Limit Theorem: Sample means approach normality as sample size increases.
- Standard Error:

6. Hypothesis Testing
Key Steps
- State null and alternative hypotheses.
- Select significance level, usually 0.05.
- Choose test statistic (z, t, chi-square, F).
- Define decision rule.
- Calculate statistic and make decision.
Types of Errors:
- Type I: Reject when true (false positive).
- Type II: Fail to reject when false (false negative).
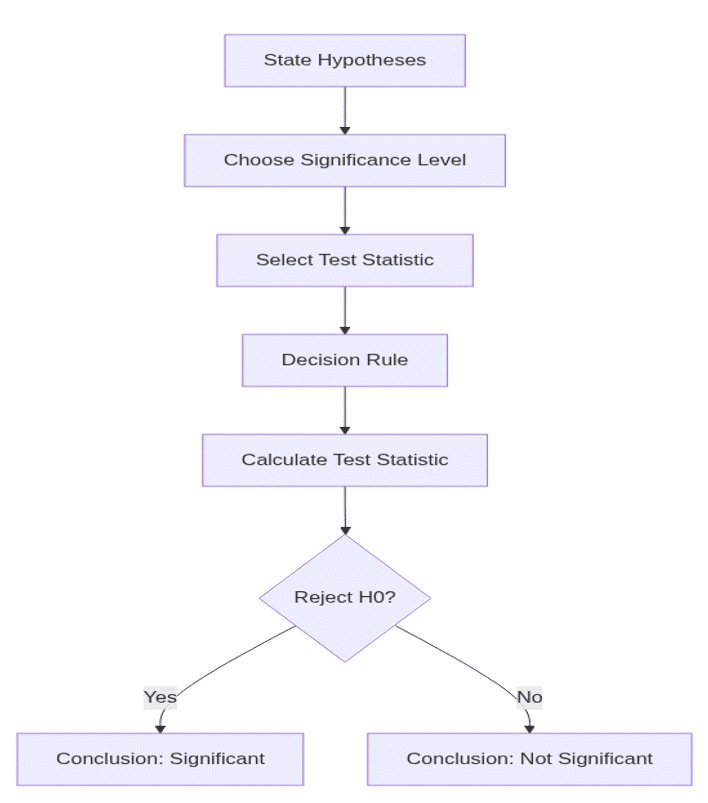
Hypothesis Testing Flowchart
7. Parametric vs Non-Parametric Tests
- Parametric: Assume normal distribution, test means/variances (z, t, F, chi-square).
- Non-Parametric: No distribution assumption, use ranks/signs (Wilcoxon, Mann-Whitney).
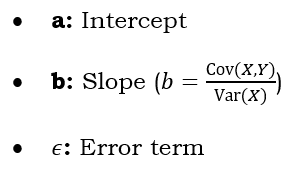
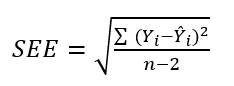
8. Simple Linear Regression
Model:
Goodness-of-Fit:
- R-squared (R2 ): % of Y explained by X
- Standard Error of Estimate (SEE):

9. Simulation Methods
- Monte Carlo Simulation: Repeated random sampling to estimate outcomes.
- Bootstrapping: Resampling with replacement to estimate statistics.
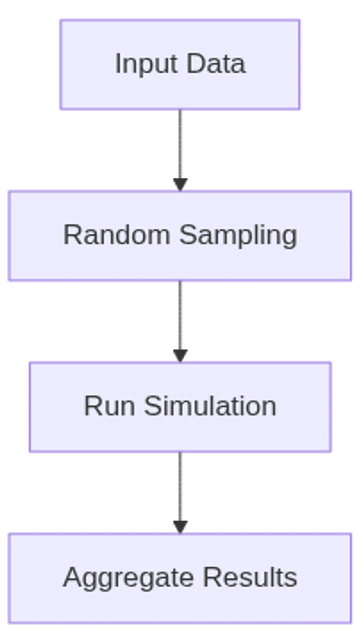
Simulation Flow
10. Big Data and Machine Learning (Intro)
- Big Data: Large, complex datasets.
- Machine Learning: Algorithms that learn from data.
- Applications: Forecasting, risk management, trading.
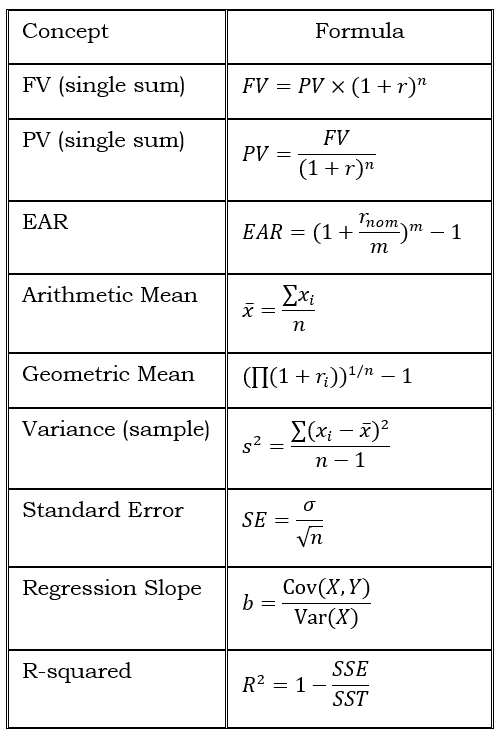
11. Key Formula Summary Table
Visual Learning Tips
- Use timelines for TVM problems.
- Draw box-plots and histograms to understand distributions.
- Sketch normal curves and shade areas for probability questions.
- Map out regression lines and scatter plots for relationships.
- Practice with flowcharts for hypothesis testing and simulation