When you launch a marketing campaign, you probably wonder: Are people actually looking at my call-to-action button? Does my product image grab attention, or do visitors scroll right past it? These questions keep marketers up at night. The answer lies in a powerful tool that’s transforming how brands understand user behavior: attention heatmaps marketing. Unlike traditional analytics that only tell you where users clicked or how far they scrolled, attention heatmaps reveal where users actually focus their eyes. They show you the visual hierarchy your audience experiences, highlighting the hot zones that capture attention and the cold zones they ignore. For digital marketers, e-commerce managers, and UX designers, this insight is gold.
In this guide, we’ll explore what attention heatmaps are, how they work, and why they’ve become essential for optimizing everything from ad creatives to website layouts. We’ll also look at real-world examples and actionable strategies to help you leverage this technology for better marketing results.
What Are Attention Heatmaps and How Do They Work?
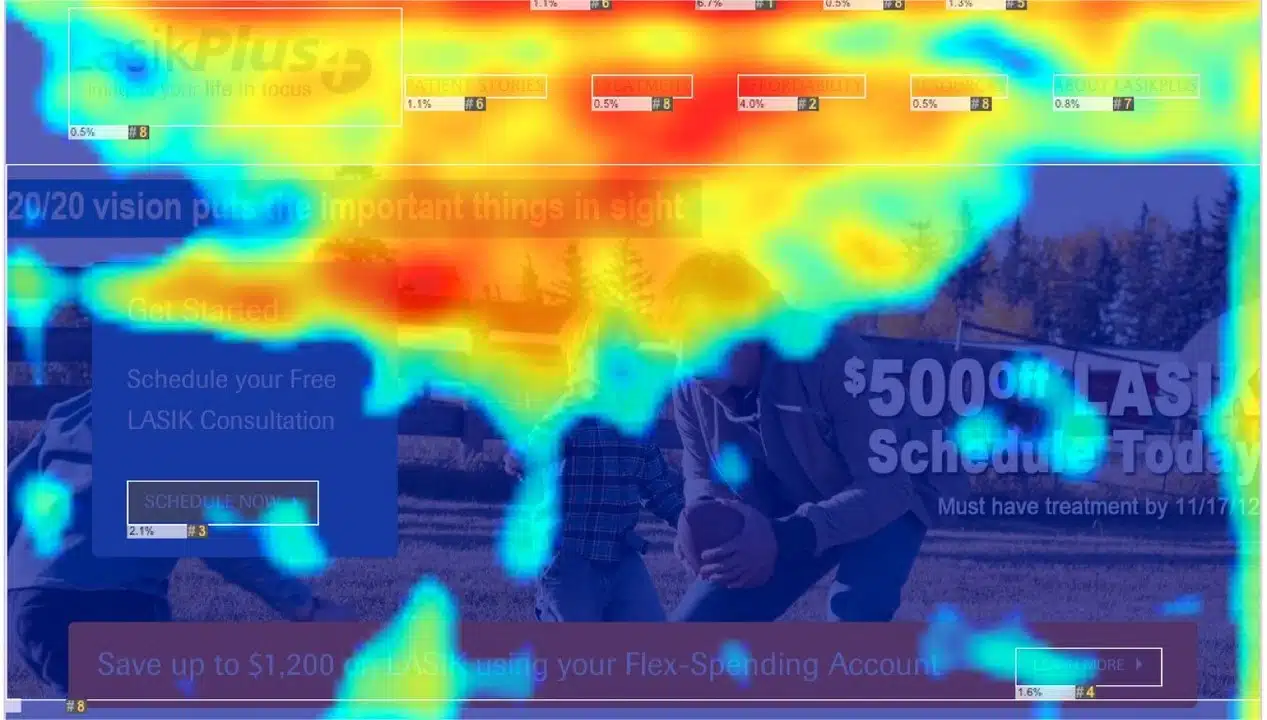
Attention heatmaps are visual representations that show where users focus their attention on digital content, using color gradients to highlight engagement levels. Think of them as a map of human attention, where warmer colors like red and orange indicate high-focus areas, while cooler tones like blue and green reveal zones where engagement drops off.
The key difference between attention heatmaps and traditional click heatmaps is fundamental: click heatmaps show you where users clicked, but attention heatmaps reveal where users looked. This distinction matters because people often look at something before deciding whether to click it. By understanding visual attention patterns, you gain insight into what actually captures human interest.
How the Technology Works
Attention heatmaps use AI and eye-tracking simulation to predict where people’s eyes will go first. The system analyzes visual elements like color contrast, size, positioning, and layout to determine what naturally draws the human eye. Rather than requiring expensive eye-tracking equipment, modern AI-powered attention heatmaps generate saliency maps that simulate human eye behavior at scale. The result is a color-coded visualization showing engagement intensity across your visual content.
When you hover over different sections, you’ll see metrics like view percentage, average engagement time, and scroll depth. This granular data transforms abstract questions about user attention into concrete, actionable insights.
The Evolution: From Traditional Heatmaps to AI-Powered Attention Tracking
Digital marketers have relied on heatmaps for years, but the technology has evolved significantly. Early heatmaps focused on click patterns and scroll behavior, providing a basic understanding of user interaction. While valuable, these tools had a blind spot: they couldn’t predict what users would focus on before they interacted with content.
The emergence of AI-powered attention heatmaps changed the game. By leveraging machine learning algorithms that simulate human visual attention, marketers can now test ad creatives, packaging designs, and website layouts before launching them to real audiences. This predictive capability allows teams to optimize designs with confidence, reducing the risk of campaigns that miss the mark.
Today’s attention heatmaps combine the best of both worlds: they show actual user behavior through eye-tracking data while also providing predictive insights through AI simulation. This dual approach gives marketers a comprehensive understanding of visual engagement analytics across different audience segments, devices, and demographics.
Where Attention Heatmaps Make the Biggest Impact
Ad Creative and CTA Placement
One of the most critical applications of attention heatmaps is optimizing call-to-action buttons and key messaging placement. A campaign’s success often hinges on whether your CTA gets noticed. By analyzing where users naturally look first, you can position your CTA in high-attention zones rather than hoping users find it. For example, if an attention heatmap reveals that users focus heavily on the center of an ad but ignore the bottom right corner, you’d move your CTA accordingly. This simple repositioning can dramatically improve click-through rates and conversion performance.
E-Commerce Product Pages
E-commerce managers use attention heatmaps to understand which product image elements drive conversions. Does the product photo capture attention? Are customers noticing the price, or does it get overlooked? Are key product features visible enough? By analyzing user attention tracking on product pages, retailers can optimize product photography, highlight key features, and adjust pricing visibility to maximize sales. An e-commerce site might discover that product images receive high engagement but the “Add to Cart” button gets ignored, signaling a need to redesign the button for prominence and clarity.
Website Behavior Insights and UX Optimization
Beyond individual elements, attention heatmaps help optimize overall website design and user experience. By understanding how users navigate and interact with digital content, you can identify opportunities to improve layout, rearrange content, and ensure important information is easily accessible. If a significant portion of users don’t scroll past a certain point on your page, it might indicate content overload or that crucial information needs to be moved higher. Attention heatmaps reveal these drop-off points, enabling data-driven decisions about content hierarchy and page structure.
Packaging and Physical Retail Design
While digital applications dominate, attention heatmaps also optimize physical spaces. Before a product hits shelves, AI-powered heatmaps ensure that brand logos, claims, and pricing are visually prominent. Retailers use heatmaps to understand foot traffic patterns and correlate customer attention with sales performance, identifying areas that need redesign for better product appeal.
Advanced Tactics: Maximizing the Power of Attention Heatmaps
Segment Your Audience for Deeper Insights
Not all users have the same visual attention patterns. Younger audiences might focus on trendy design elements, while older customers may prioritize clear navigation. Modern attention heatmap tools allow you to layer demographic data, creating segment-specific insights. By analyzing how different age groups, interests, or locations focus on your content, you can create personalized variations that resonate with each segment. This level of precision in user attention tracking enables hyper-targeted optimization.
Test Multiple Design Variations Rapidly
One of the biggest advantages of AI-powered attention heatmaps is speed. Instead of running lengthy A/B tests with real users, you can test dozens of design variations instantly using predictive heatmaps. This “precision at scale” lets you compare how different audience segments respond to various layouts, colors, and messaging placements before committing resources to a full campaign.
Correlate Attention Data with Business Outcomes
The most sophisticated marketers link attention heatmap data directly to sales figures and conversion metrics. This correlation reveals whether high attention actually translates to desired business outcomes. Sometimes users focus on an element but don’t convert, signaling that attention alone isn’t enough—the element itself might need refinement. By connecting visual engagement analytics to revenue data, you move beyond vanity metrics and focus on attention patterns that actually drive business results.
The Business Case: How Attention Heatmaps Drive Real Results
Let’s look at a concrete example. A mid-sized e-commerce brand selling fitness equipment noticed declining conversion rates despite increasing website traffic. Using traditional analytics, they saw that users were visiting product pages but not completing purchases. When they implemented AI attention heatmaps, the insights were revealing. The analysis showed that customers focused heavily on product images and descriptions but largely ignored the pricing and “Add to Cart” button. The button was positioned in a low-attention zone, buried below other elements. The team redesigned the page layout, repositioning the CTA button to a high-attention area and increasing its visual prominence through color contrast. They also simplified the checkout process, removing friction points that attention heatmaps revealed were causing users to lose focus. The results: a 34% increase in click-through rates on the CTA button and a 22% improvement in conversion rates within six weeks. By understanding where users actually looked, they optimized the user experience for attention, not just aesthetics. This case study illustrates why attention heatmaps have become essential for data-driven marketers. They transform guesswork into insight, enabling optimization based on how human attention actually works.
Measuring Success: Key Metrics and Analytics
When using attention heatmaps, focus on these critical metrics:
- View Percentage: The percentage of all visitors who saw a specific section of your page. If crucial information has a low view percentage, it’s being missed.
- Average Engagement Time: How long users spend viewing each section. Longer engagement on key sections indicates effective attention capture.
- Average Engagement: Aggregates clicking, scrolling, and mouse movement for specific areas, providing a holistic engagement picture.
- Scroll Depth: How far users scroll down your page, revealing content visibility and engagement levels.
By tracking these metrics over time and comparing them across design variations, you build a data-backed understanding of what captures and maintains user attention.
Actionable Tips for Implementing Attention Heatmaps
- Start with high-stakes content: Apply attention heatmaps first to your most important pages—product pages, landing pages, and checkout flows where attention directly impacts revenue.
- Test before launch: Use predictive attention heatmaps to validate design decisions before committing to full campaigns. This reduces risk and accelerates optimization cycles.
- Identify dead zones: Look for areas where users consistently ignore content. Either remove these elements or redesign them to capture attention through color, contrast, or positioning.
- Optimize CTA placement: Ensure your call-to-action buttons sit in high-attention zones. If they’re currently ignored, reposition or redesign them.
- Adapt for different devices: Hot zones differ significantly across mobile, tablet, and desktop. Test and optimize layouts for each screen size separately.
- Combine with user feedback: Attention heatmaps show where users look, but user testing reveals why. Use both methods together for complete understanding.
- Monitor competitive designs: Analyze how your audience’s attention compares to competitor websites. Identify gaps where you can capture more focus.
Developing Expertise in Attention Heatmaps and Digital Marketing
Understanding attention heatmaps is just one piece of modern digital marketing mastery. To truly excel in this field, you need comprehensive knowledge of how attention tracking integrates with broader marketing strategy, AI applications, and data analytics. This is where structured learning becomes invaluable. Professionals who want to master attention heatmaps alongside other cutting-edge marketing tools benefit from courses that cover the full spectrum of digital marketing and artificial intelligence. Programs that combine theoretical knowledge with hands-on experience using real tools and platforms accelerate your ability to apply these concepts in professional settings.
Amquest Education’s Digital Marketing and Artificial Intelligence course is specifically designed for professionals seeking this comprehensive expertise. The program covers attention heatmaps, user behavior analytics, AI-powered marketing tools, and practical applications through real-world projects. With faculty who bring direct industry experience and partnerships with leading companies, the course goes beyond theory to deliver practical skills you can apply immediately. The program includes internship opportunities with industry partners, giving you hands-on experience optimizing real campaigns using attention heatmaps and other advanced tools. Whether you’re based in Mumbai or anywhere else in India, you can access the course online while building a portfolio of work that demonstrates mastery to potential employers.
Conclusion
Attention heatmaps represent a fundamental shift in how marketers understand their audiences. By revealing where users actually focus their attention, these tools enable optimization based on human psychology rather than guesswork. Whether you’re refining ad creatives, optimizing website layouts, or designing product pages, attention heatmaps marketing provides the insights needed to capture attention and drive conversions. The brands winning today aren’t just collecting data—they’re understanding attention. They’re using tools like attention heatmaps to decode visual engagement patterns and create experiences that naturally guide users toward desired actions. As competition intensifies across every industry, this capability becomes increasingly valuable. If you’re serious about mastering attention heatmaps and becoming proficient with the full suite of modern digital marketing tools, now is the time to invest in your skills. The professionals who understand how to leverage attention tracking, user behavior analytics, and AI-powered optimization will be the ones driving results for their organizations.
Frequently Asked Questions
What’s the difference between attention heatmaps and click heatmaps?
Click heatmaps show where users clicked on a page, while attention heatmaps reveal where users looked. Attention heatmaps use eye-tracking technology or AI simulation to predict visual focus, giving you insight into user behavior before they interact with elements. This distinction is crucial because users often look at something before deciding whether to click it.
How do AI-powered attention heatmaps differ from traditional eye-tracking studies?
Traditional eye-tracking requires expensive equipment and small sample sizes. AI-powered attention heatmaps simulate human eye behavior using machine learning, allowing you to test designs at scale and across different audience segments instantly. This makes attention heatmaps marketing more accessible and faster than traditional methods.
Can attention heatmaps help with mobile optimization?
Absolutely. Hot zones differ significantly across mobile, tablet, and desktop devices. By analyzing user attention tracking separately for each screen size, you can optimize layouts specifically for how mobile users focus on content, ensuring important elements are visible and accessible on smaller screens.
What metrics should I track when using attention heatmaps?
Focus on view percentage (what percentage of visitors saw each section), average engagement time (how long users spend on each area), average engagement (clicks, scrolling, and mouse movement combined), and scroll depth (how far users scroll). These metrics reveal which elements capture attention and which get ignored.
How can I use attention heatmaps to improve conversion rates?
Identify where users focus their attention on your pages, then ensure your call-to-action buttons and key conversion elements sit in these high-attention zones. If important elements are in low-attention areas, reposition or redesign them to capture focus through color contrast, size, or positioning.
Are attention heatmaps useful for e-commerce businesses?
Yes, e-commerce managers use attention heatmaps to optimize product pages, understand which product features capture attention, and identify why users might not be converting. By correlating attention data with sales figures, retailers can see how customer focus translates to actual purchases and adjust designs accordingly.