1. Fixed-Income Instrument Features
Key Concepts:
- Bond: Debt security representing a loan from investor to issuer (government, corporation).
- Face Value (Par): Amount repaid at maturity (e.g., $1,000).
- Coupon Rate: Annual interest rate paid on face value.
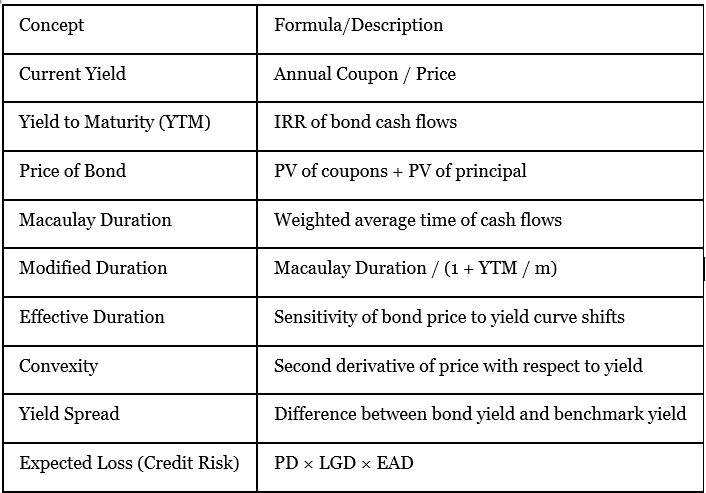
- Yield to Maturity (YTM): Total expected return if held to maturity, assuming reinvestment at YTM.
- Issuer Types:
- Government (Sovereign, Supranational, Agencies)
- Corporate
- Special Purpose Entities (ABS)
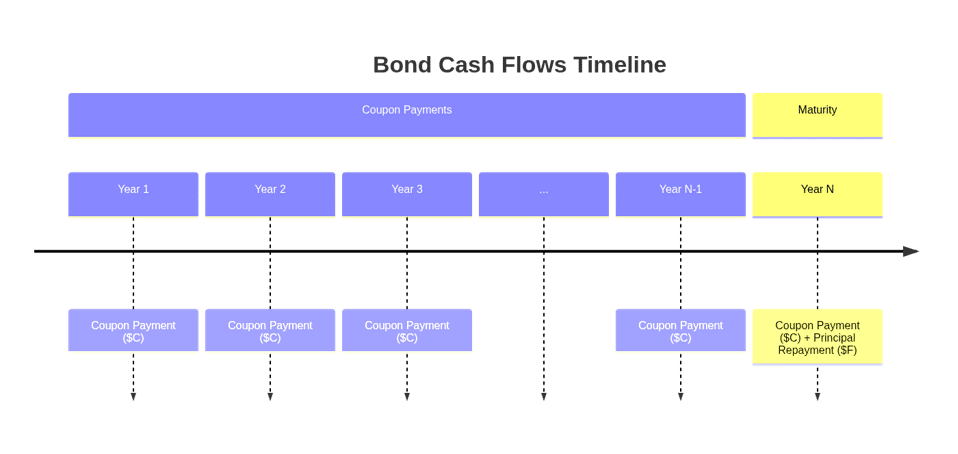
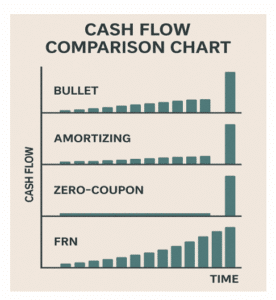
2. Fixed-Income Cash Flows and Types
Cash Flow Structures:
- Bullet Bonds: Fixed coupon, principal repaid at maturity.
- Amortizing Bonds: Principal repaid over time, reducing credit risk.
- Zero-Coupon Bonds: No coupons, single payment at maturity.
- Floating Rate Notes (FRN’s): Coupon = Market Reference Rate (MRR) + Credit Spread.
- Step-Up Bonds: Coupon increases at specified dates.
- PIK Bonds: Interest paid by increasing principal.
3. Fixed-Income Issuance and Trading
Key Points:
- Primary Market: New bond issuance via auctions, private placements, or public offerings.
- Secondary Market: OTC or quote-driven markets where bonds trade after issuance.
- Liquidity: On-the-run bonds are most liquid; off-the-run less so.
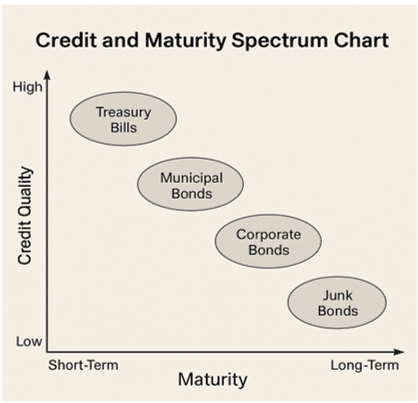
- Credit Ratings: Investment grade (BBB-/Baa3 and above), High yield (below BBB-).
4. Fixed-Income Markets for Corporate Issuers
Short-Term Funding:
- Commercial Paper: Unsecured, short-term notes.
- Bank Credit Lines: Committed and uncommitted lines.
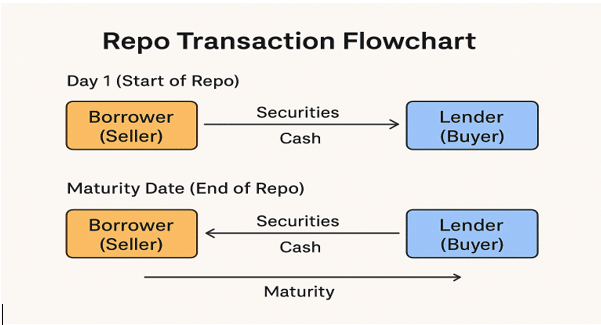
- Repos: Collateralized loans with repurchase agreements.
5. Fixed-Income Markets for Government Issuers
Key Concepts:
- Sovereign Debt: Issued by national governments; often considered risk-free benchmark.
- Quasi-Government and Supranational Bonds: Issued by agencies or international bodies.
- Auction Types: Single-price vs. multiple-price auctions.
- On-the-Run vs. Off-the-Run: Most recent issues vs. older bonds.
6. Fixed-Income Bond Valuation: Prices and Yields
Valuation:
- Present value of future cash flows discounted at YTM.
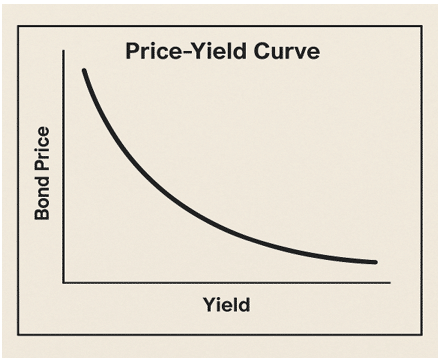
- Price-Yield Relationship: Inverse; higher yield → lower price.
- Full Price (Dirty Price) = Clean Price + Accrued Interest.
Yield Measures:
- Current Yield = Annual Coupon / Price.
- Yield to Call, Yield to Worst, Option-Adjusted Yield.
7. Yield and Yield Spread Measures for Fixed-Rate Bonds
Yield Spreads:
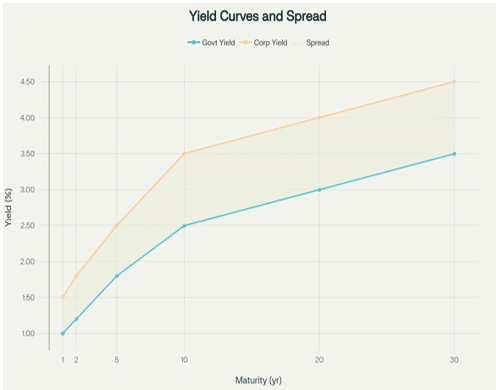
- G-Spread: Spread over government bond yield.
- I-Spread: Spread over swap rates.
- Z-Spread: Constant spread added to spot rates to match bond price.
8. Yield and Yield Spread Measures for Floating-Rate Instruments
Key Points:
- FRN’s have coupons that reset periodically.
- Quoted Margin: Fixed spread over reference rate.
- Required Margin: Market-implied spread at reset date.
- Premium/Discount depends on relation between quoted and required margin.
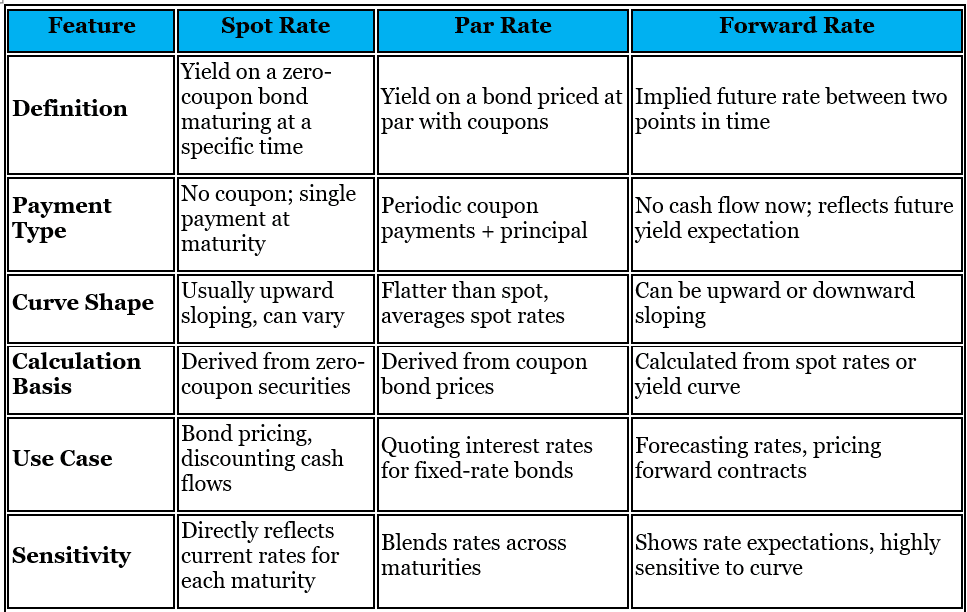
9. The Term Structure of Interest Rates: Spot, Par, and Forward Curves
Concepts:
- Spot Rates: Yield for zero-coupon bonds at different maturities.
- Par Rates: Coupon rate that prices bond at par.
- Forward Rates: Implied future interest rates.
Formulas
Spot Rate: =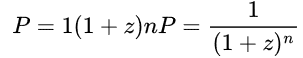
Forward Rate 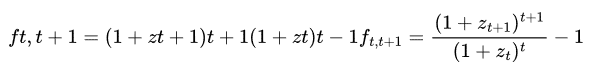
10. Interest Rate Risk and Return
Price-Yield Relationship
- Bond prices and yields move inversely.
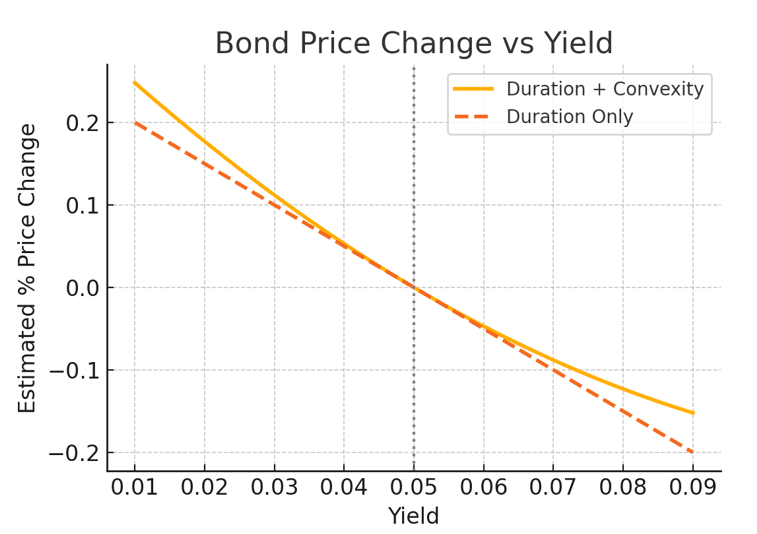
- The relationship is convex: price declines more when yields rise than they increase when yields fall.
Duration
- Measures the sensitivity of a bond’s price to changes in interest rates.
- Types include Macaulay duration (time-weighted cash flows) and Modified duration (price sensitivity).
- Greater duration = greater interest rate risk.
Convexity
- Measures the curvature in the price-yield relationship.
- Bonds with higher convexity are less affected by large changes in interest rates.
- Convexity improves the duration estimate when yield changes are large.
Effective Duration vs. Modified Duration
- Modified duration is used for bonds with fixed cash flows.
- Effective duration is used when cash flows may change (e.g., callable or putable bonds).
Key Rate Duration
- Measures sensitivity to changes in specific points along the yield curve.
- Useful for understanding how non-parallel shifts in the curve affect bond prices.
Factors Affecting Interest Rate Risk
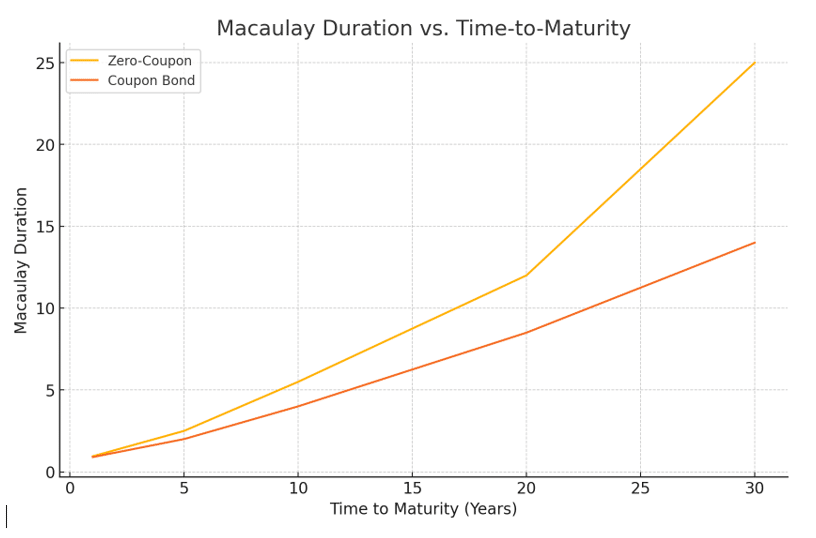
- Time to maturity: longer maturity increases risk.
- Coupon rate: lower coupons increase risk.
- Yield level: bonds with lower yields have higher duration.
Managing Interest Rate Risk
- Use of immunization techniques (duration matching).
- Barbell and bullet portfolio strategies.
- Hedging using interest rate derivatives.
11: Yield-Based Bond Duration Measures and Properties
This module explores the measures of interest rate risk for fixed-income instruments assuming fixed cash flows. Key metrics include Modified Duration, Money Duration, and Price Value of a Basis Point (PVBP), which are essential tools in bond pricing and portfolio risk estimation.
Key Duration Measures
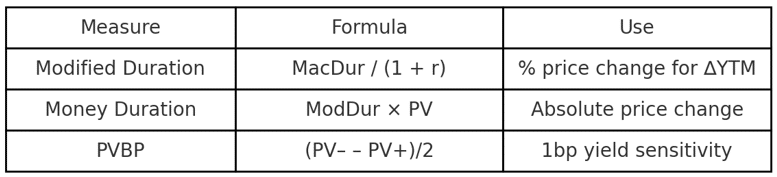
► Modified Duration: Measures the % change in bond price for a 1% change in yield.
► Macaulay Duration: Weighted average time to receive cash flows.
► Money Duration: Modified Duration × Full Price; gives change in value in currency terms.
► PVBP: Price change for a 1 basis point (0.01%) change in yield.
Factors Influencing Duration
► Longer Time to Maturity → ↑ Duration
► Lower Coupon Rate → ↑ Duration
► Lower Yield-to-Maturity → ↑ Duration
► Closer to Next Coupon Date → ↓ Duration (t/T ↑)
Application Insights
- Duration provides a linear estimate of bond price changes but ignores convexity.
- For large interest rate changes or complex bonds, duration alone may misestimate risk.
- Duration metrics are especially useful for risk management, immunization strategies, and estimating portfolio sensitivity12: Convexity and Portfolio Duration
This module expands on interest rate sensitivity by introducing convexity, which improves upon the linear estimate provided by duration. It also explores how to measure and interpret portfolio duration and convexity.
Understanding Convexity
► Convexity measures the curvature in the relationship between bond prices and yields.
► It improves estimation accuracy for larger yield changes.
► Positive convexity means price rises more when yields fall than it falls when yields rise by the same amount.
Convexity Formula:
Convexity = (P₋ + P₊ – 2P₀) / (P₀ × Δy²)
Approximate Price Change
Total % Price Change ≈ -Duration × Δy + ½ × Convexity × (Δy)²
This formula combines linear (duration) and non-linear (convexity) effects to improve bond price movement estimates.
Portfolio Duration
► Portfolio Duration = Weighted average of individual bond durations
► Measures sensitivity of the portfolio to parallel shifts in yield curve
► Effective for passive management and immunization strategies
Portfolio Duration = Σ (wᵢ × Dᵢ)
Applications and Insights
• Use both duration and convexity for accurate bond price estimates.
• For immunization, match asset and liability duration and convexity.
• Monitor yield curve shifts: parallel shifts suit duration analysis; non-parallel shifts require key rate durations.
13: Curve-Based and Empirical Risk Measures
Yield Curve Risk Measures
- Yield curve represents interest rates across different maturities.
- Used to evaluate how bond prices and portfolio values respond to changes in interest rates.
Key Rate Duration
- Measures sensitivity of a bond’s price to changes in yields at specific maturity points.
- Helps assess impact of non-parallel yield curve shifts (e.g., steepening or flattening).
Empirical Duration Measures
- Based on observed changes in bond prices and yields in the market.
- Can reflect factors such as credit spreads and liquidity changes beyond theoretical duration.
Scenario Analysis
- Tests bond or portfolio performance under specific hypothetical yield curve changes.
- Useful for understanding exposure to complex yield movements beyond parallel shifts.
Principal Component Analysis (PCA)
- Statistical method used to reduce dimensionality of yield curve movements.
- Typically, the first three components represent: level (parallel shifts), slope (steepening/flattening), and curvature.
Limitations of Empirical Measures
- Empirical results are sensitive to historical data periods and assumptions.
- They may not fully capture future market dynamics or structural breaks.
14: Credit risk
Definition of Credit Risk
- Credit risk is the risk of loss resulting from a borrower’s failure to make full and timely payments.
- It includes default risk, credit migration (downgrade) risk, and spread risk.
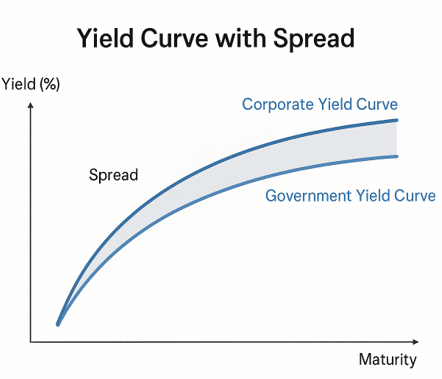
Credit Spread
- The yield difference between a corporate bond and a risk-free government bond of similar maturity.
- Reflects default risk, liquidity, and macroeconomic conditions.
Credit Ratings
- Assigned by agencies (e.g., Moody’s, S&P) based on an issuer’s ability to repay debt.
- Investment-grade: higher quality; Speculative-grade: higher risk, higher return potential.
- Ratings may lag market sentiment and are not guarantees of performance.
Credit Analysis Framework
- CFA (Capacity, Collateral, Covenants, Character): key components of assessing creditworthiness.
- Capacity = ability to pay; Collateral = assets backing the bond; Covenants = legal protections; Character = issuer’s reputation and governance.
Credit Curve
- A plot of yield spread vs. maturity for bonds of the same credit quality.
- Typically upward-sloping due to higher uncertainty over longer terms.
Credit Migration and Downgrade Risk
- Migration risk is the chance that an issuer’s credit rating changes (usually downwards), increasing yields and reducing bond value.
- Downgrades can trigger portfolio rebalancing or forced selling, especially in investment-grade mandates.
Managing Credit Risk
- Diversification across issuers and sectors.
- Credit default swaps (CDS) and other derivatives for hedging.
- Continuous monitoring of issuer fundamentals and market indicators.
15: Credit Analysis for Government Issuers
Purpose of Government Credit Analysis
- Assess the ability and willingness of a government to meet its debt obligations.
- Key for pricing sovereign and municipal debt instruments.
Sovereign Credit Risk Factors
- Economic strength: GDP size, growth, diversification.
- Institutional strength: rule of law, transparency, corruption levels.
- Fiscal strength: debt-to-GDP ratio, fiscal deficit/surplus, revenue base.
- External strength: foreign reserves, current account balance, exchange rate flexibility.
Local vs. Foreign Currency Risk
- Governments are generally less likely to default on local currency debt (can print money).
- Foreign currency debt riskier due to dependency on FX reserves and external factors.
Municipal Credit Risk Factors
- Revenue structure: reliance on taxes, transfers, or fees.
- Expenditure obligations: pensions, healthcare, education mandates.
- Legal framework: ability to raise taxes, declare bankruptcy, or receive federal support.
Credit Ratings and Market Perception
- Assigned by agencies based on economic, financial, and political assessments.
- A downgrade can increase borrowing costs and reduce investor demand.
Monitoring and Ongoing Risk Assessment
- Macro indicators: inflation, unemployment, trade balance.
- Political risk: elections, instability, policy direction.
- Contingent liabilities: state-owned enterprises, bailouts, natural disaster exposure.
16. Corporate Credit Analysis
Purpose of Corporate Credit Analysis
- Evaluate the risk of loss due to a corporation’s inability or unwillingness to meet debt obligations.
- Helps investors, rating agencies, and underwriters assess default risk and pricing.
Key Analytical Areas (The 4 Cs)
- Capacity – Company’s ability to generate sufficient cash flows to meet obligations.
- Collateral – Assets available to back debt, especially important for secured issues.
- Covenants – Legal terms that protect creditor interests and limit borrower risk-taking.
- Character – Quality of management and governance, historical track record.
Quantitative Credit Metrics
- Leverage ratios: Debt/EBITDA, Debt/Equity, Interest Coverage Ratio.
- Profitability and margins: ROE, Operating Margin, Net Profit Margin.
- Cash flow metrics: Free Cash Flow, CFO/Total Debt.
Industry and Competitive Position
- Assess industry cyclicality, barriers to entry, customer concentration.
- Company’s market share, pricing power, cost structure, and innovation capacity.
Event Risk and Structural Considerations
- M&A activity, shareholder returns (dividends, buybacks) may increase leverage.
- Subordination of debt affects recovery values in default.
Credit Ratings Impact
- Ratings reflect relative credit risk and affect borrowing costs.
- Downgrades may lead to higher spreads and loss of investor access.
17. Fixed-Income Securitization
What is Securitization?
- The process of pooling financial assets and issuing securities backed by those assets.
- Provides liquidity to lenders and broadens access to capital markets.
Structure of a Securitization
- Originator: Creates and sells the asset pool.
- SPV (Special Purpose Vehicle): A bankruptcy-remote entity that holds the assets and issues securities.
- Tranches: Securities issued in different layers of risk and return (senior, mezzanine, equity).
Types of Securitized Products
- MBS (Mortgage-Backed Securities): Backed by pools of mortgages.
- ABS (Asset-Backed Securities): Backed by auto loans, credit card receivables, etc.
- CMBS (Commercial MBS): Backed by income-producing commercial properties.
Credit Enhancement Techniques
- Internal: Subordination, overcollateralization, reserve funds.
- External: Third-party guarantees or insurance to support credit quality.
Prepayment and Extension Risk
- Prepayment Risk: Early repayments reduce interest income (affects MBS).
- Extension Risk: Slower-than-expected repayments during rising interest rates extend duration.
Tranche-Specific Risk and Return
- Senior tranches have lower risk and lower yield due to payment priority.
- Junior tranches bear first losses but offer higher potential return.
Role in Financial Markets
- Expands access to funding for lenders.
- Transfers risk to investors and diversifies funding sources.
- Can amplify systemic risk if poorly regulated or structured (e.g., subprime crisis).
18. Asset-Backed Securities (ABS) and Market Features
Definition and Characteristics of ABS
- ABS are securities backed by pools of non-mortgage assets like auto loans, credit cards, and student loans.
- Provide investors with exposure to diversified cash flows from financial assets.
Common Types of ABS
- Auto Loan ABS – backed by fixed-term auto installment loans.
- Credit Card ABS – backed by revolving credit lines; principal payments are delayed.
- Student Loan ABS – backed by federal or private student loans.
Structural Features
- Tranching: Divides credit risk and return among senior, mezzanine, and junior tranches.
- Bullet vs. Amortizing Structures: Bullet pays principal at maturity; amortizing pays over time.
- Floating vs. Fixed Rates: Based on underlying asset structure and investor demand.
Cash Flow Allocation
- Waterfall structure governs priority of payments: interest, then principal, and finally residuals.
- Early amortization and prepayment features influence cash flows and risk.
Credit Enhancement Methods
- Internal: Excess spread, overcollateralization, subordination.
- External: Surety bonds, letters of credit, guarantees.
Market Features and Participants
- Buyers include institutional investors (pension funds, insurance, asset managers).
- ABS markets are typically over-the-counter (OTC) and can vary in liquidity and transparency.
Risks in ABS Investments
- Credit risk, prepayment risk, extension risk, and liquidity risk.
- Legal risk may arise from servicing disputes or collateral enforceability.
19. Mortgage-Backed Securities (MBS)
What Are MBS?
- MBS are securities backed by pools of mortgage loans.
- Investors receive cash flows from principal and interest payments of underlying mortgages.
Types of MBS
- Agency MBS: Issued by Ginnie Mae, Fannie Mae, or Freddie Mac (often have guarantees).
- Non-agency MBS: Issued by private entities, carry credit risk and require credit enhancement.
- Pass-through Securities: Cash flows are passed directly to investors.
- Collateralized Mortgage Obligations (CMOs): Structured into tranches with varying risk and maturity.
Prepayment Risk
- Prepayment risk arises when borrowers repay mortgages earlier than expected, especially when interest rates fall.
- Leads to reinvestment risk for investors and affects MBS valuation.
Extension Risk
- Occurs when interest rates rise and borrowers slow down repayments.
- Extends the duration of the MBS and may reduce liquidity.
Tranching and Structuring
- CMOs divide cash flows into tranches with different risk and maturity profiles.
- Planned Amortization Class (PAC) tranches have more stable cash flows.
- Support tranches absorb variability in prepayments.
MBS Market Features
- Highly liquid market for agency MBS; less so for non-agency.
- Traded mostly over-the-counter (OTC).
- Used by institutional investors for portfolio diversification and yield enhancement.
Yield and Pricing
- Yield is influenced by interest rates, prepayment speeds, and credit quality.
- Models like PSA (Prepayment Speed Assumption) are used to estimate cash flows.
Key Formulas Summary
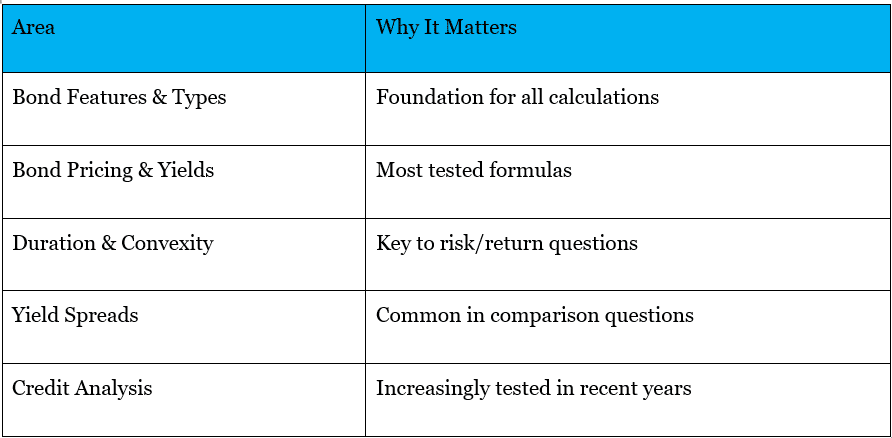
20. Exam Tips
1. Master Your Calculator
The Fixed Income section is calculation-heavy. Know your calculator’s TVM, bond, and amortization functions thoroughly. Practice entering cash flows, calculating YTM, duration, and price/yield relationships quickly and accurately.
2. Focus on Key Concepts and Terminology
Understand the definitions and features of different fixed income securities, including bonds, FRN’s, and ABS. Pay special attention to terms like YTM, duration, convexity, spread, and the differences between types of issuers.
3. Prioritize the Learning Outcome Statements (LOS)
Use the LOS at the start of each reading to guide your study. These are often directly reflected in exam questions. Ensure you can “describe,” “calculate,” and “compare” as required by the LOS.
4. Don’t Get Lost in the Numbers
While calculations are important, many questions test your conceptual understanding and ability to interpret results. Make sure you can explain the price-yield relationship, effects of interest rate changes, and the impact of embedded options.
5. Practice, Practice, Practice
Work through end-of-chapter questions and CFA Institute’s online question bank. Simulate exam conditions with mixed-topic practice sets to build speed and confidence.
6. Understand the Exam Format
All questions are multiple choice, with three answer options and no penalty for guessing.
Read questions carefully and eliminate obviously incorrect choices
7. Memorize Key Formulae
Know the formulas for bond pricing, accrued interest, yield calculations, duration, and convexity by heart. Create a formula sheet for quick review before the exam.
8. Allocate Your Study Time Wisely
Fixed Income represents 11–14% of the exam (~20–25 questions). Spend more time on high-yield topics like bond valuation, risk measures, and credit analysis.
9. Review Visuals and Diagrams
Use yield curve charts, cash flow timelines, and price/yield graphs to reinforce your understanding. Visual learning aids can help you quickly recall relationships on exam day.
10. Stay Calm and Manage Your Time
If stuck on a question, make your best guess and move on—there’s no penalty for wrong answers. Leave time at the end of each session to review flagged questions.
Summary Table: High-Yield Focus Areas