Learning Module 1: Introduction to Financial Statement Analysis
Overview
This module introduces the scope, purpose, and framework of financial statement analysis. It explains how analysts use financial reports to assess a company’s performance, financial position, and future prospects.
Objectives of Financial Statement Analysis
Evaluate profitability, risk, and financial health of a business
Support investment, credit, and valuation decisions
Use financial reports to assess past performance and predict future outcomes
Key Financial Statements
Financial Reporting Standards
IFRS and US GAAP govern preparation and presentation
Promote transparency, consistency, and comparability
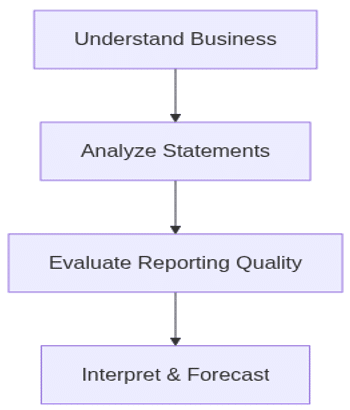
The Analyst’s Approach to FSA
Understand the Business: Industry, strategy, risks
FSA supports decision-making for equity, debt, and business analysis
Requires understanding of financial reports and standards (IFRS/GAAP)
Notes, footnotes, and MD&A enhance transparency and interpretation
Suggested Practice
Match financial statements with decision types (e.g., credit vs equity)
Identify disclosures that affect earnings quality
Practice interpreting the four core statements together
Learning Module 2: Analyzing Income Statements
Overview
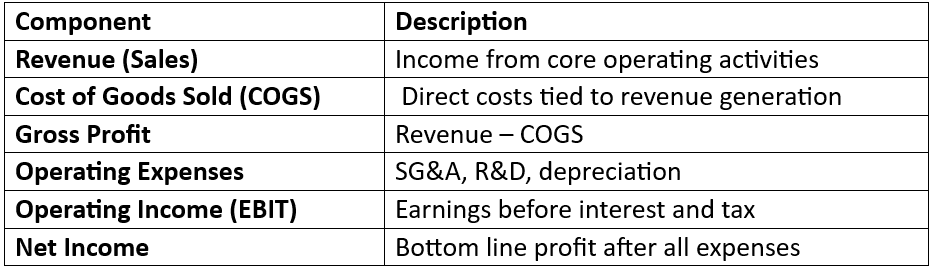
This module focuses on analyzing the income statement, which shows a company’s financial performance over a period. It explains the components of revenue, expenses, and profit, and how these affect profitability and valuation.
Structure of the Income Statement
Key Concepts
Accrual Basis: Revenues and expenses are recorded when earned/incurred, not when cash is exchanged
Multi-step vs. Single-step Statements:
Multi-step provides subtotals like gross and operating profit
Single-step aggregates all revenues and expenses
Earnings Quality Considerations
Recurring vs. Non-Recurring Items: Analysts adjust for one-time gains/losses
Operating vs. Non-Operating: Core vs. peripheral business activities
Earnings Management: Timing revenue/expense recognition to influence net income
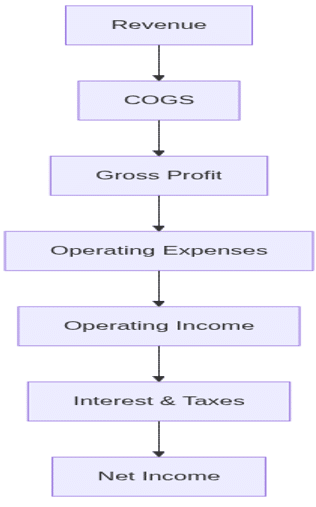
Visual: Income Statement Flow
Common Adjustments for Analysis
Exclude discontinued operations
Remove effects of changes in accounting estimates
Adjust for restructuring or impairment charges
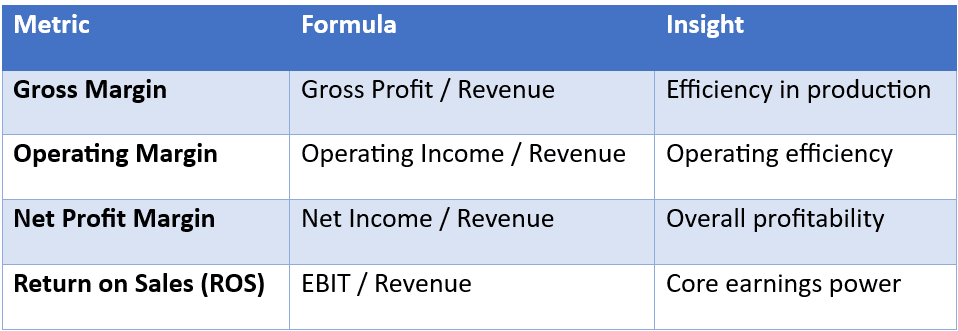
Profitability Metrics
Summary Points
Income statement shows revenues, expenses, and profitability
Adjust for unusual items to analyze sustainable earnings
Key margins reveal efficiency and financial performance
Suggested Practice
Identify and adjust for one-time items in sample statements
Calculate and interpret margin ratios
Compare operating vs. non-operating components in company reports
Learning Module 3: Analyzing Balance Sheets
Overview
This module explains the structure, components, and interpretation of the balance sheet. It provides insights into a company’s financial position at a point in time, including its assets, liabilities, and equity.
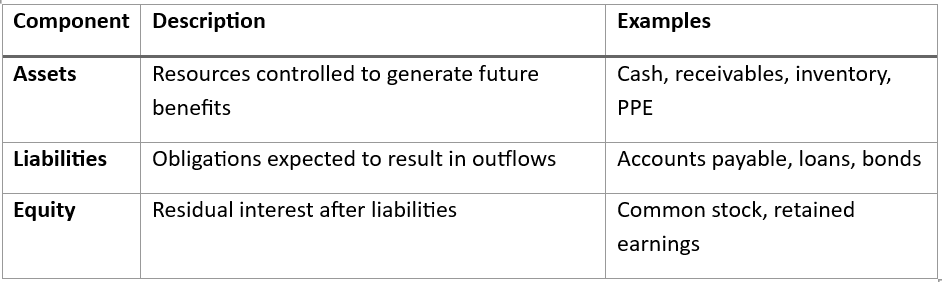
Purpose of the Balance Sheet
Shows the financial condition of a company
Presents the resources owned (assets) and claims (liabilities + equity)
Helps evaluate liquidity, solvency, and capital structure
Equation:
Assets = Liabilities + Equity
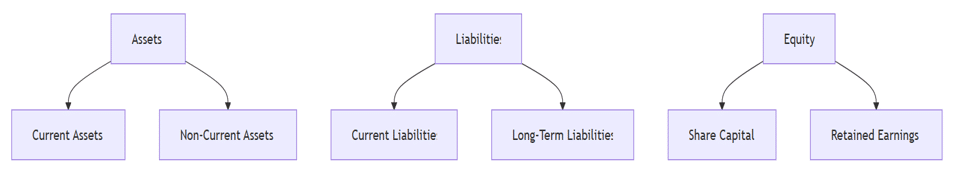
Current vs. Non-Current Items
Current: Expected to be settled/used within 12 months
Non-Current: Long-term in nature (e.g., PPE, long-term debt)
Capital Structure Mix: Debt vs equity financing implications
Summary Points
Balance sheet reveals financial position and capital structure
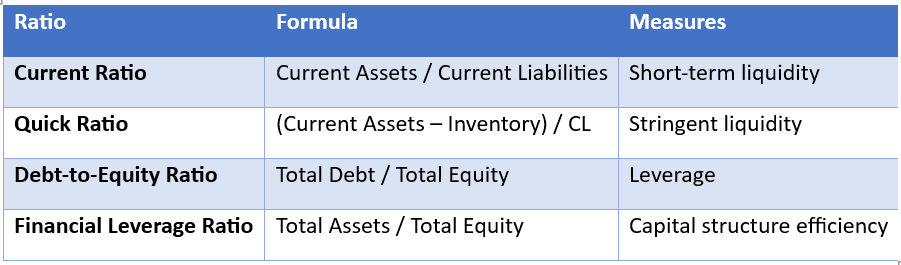
Segregates current and non-current items to assess liquidity and solvency
Key ratios provide insight into financial flexibility
Suggested Practice
Reconstruct balance sheet from transaction data
Calculate and interpret leverage and liquidity ratios
Overview
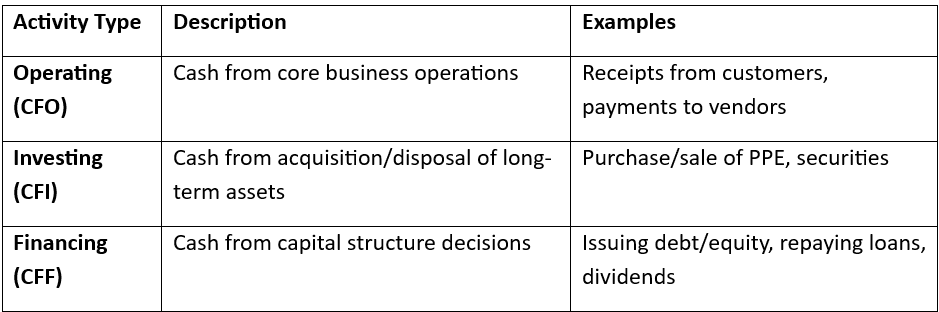
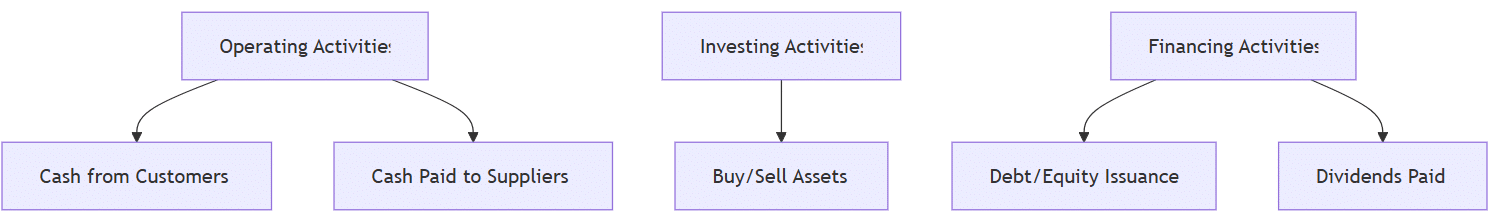
This module covers the structure and interpretation of the Cash Flow Statement, focusing on understanding how cash is generated and used in operating, investing, and financing activities.
Purpose of Cash Flow Statement
Explains changes in cash and cash equivalents
Helps evaluate liquidity, solvency, and financial flexibility
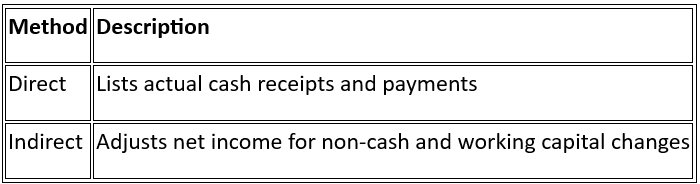
Complements the income statement by showing actual cash movements
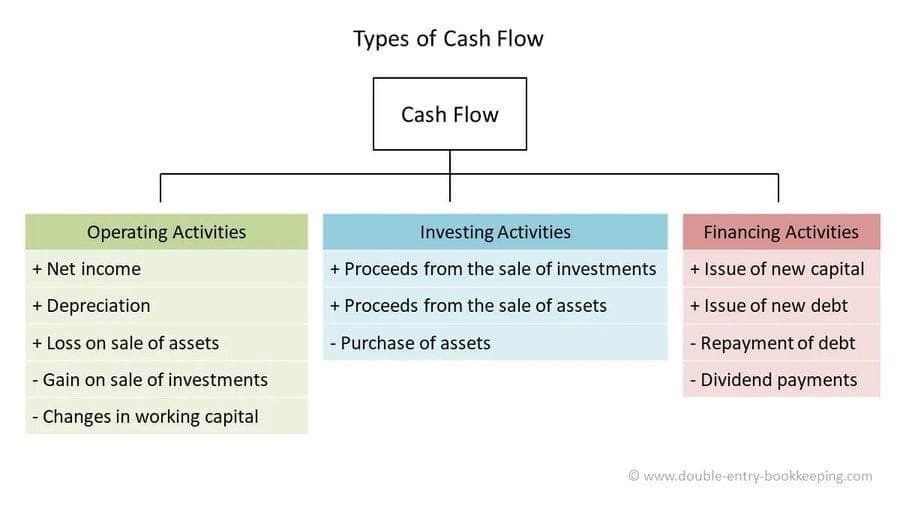
Subtract: Gains, Increase in current assets, Decrease in current liabilities
Analytical Uses
Assess quality of earnings (compare CFO to net income)
Determine sustainability of operations without external financing
Identify investment or financing trends
Summary Points
Cash flow statement clarifies actual inflows/outflows
Divided into operating, investing, and financing sections
Indirect method adjusts net income to reflect cash reality
Suggested Practice
Classify cash flows by activity type
Reconcile indirect CFO from net income
Compare CFO to net income and evaluate quality of earnings
Learning Module 5: Analyzing Cash Flow Statements II
Overview
This module builds on the understanding of the cash flow statement by diving deeper into cash flow analysis, interpretation of cash flow patterns, and how to assess a firm’s cash-generating ability and sustainability.
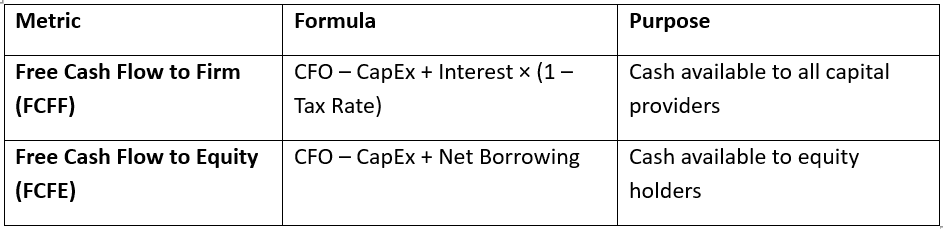
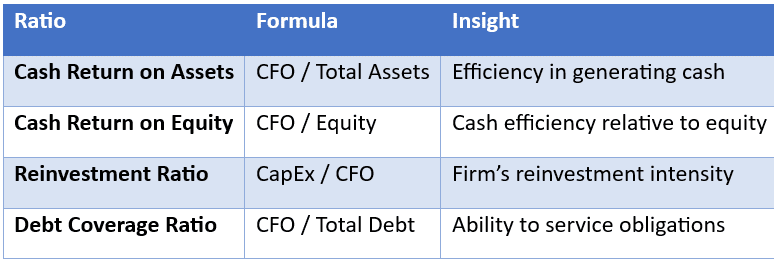
Free cash flows assess cash available for reinvestment or distribution
Ratios enhance interpretation of cash generation vs capital structure
Suggested Practice
Calculate FCFF/FCFE from sample data
Use cash-based ratios to compare peer performance
Learning Module 6: Analysis of Inventories
Overview
This module focuses on inventory accounting methods and their impact on financial statements. It helps analysts assess cost flows, earnings quality, and inventory management efficiency.
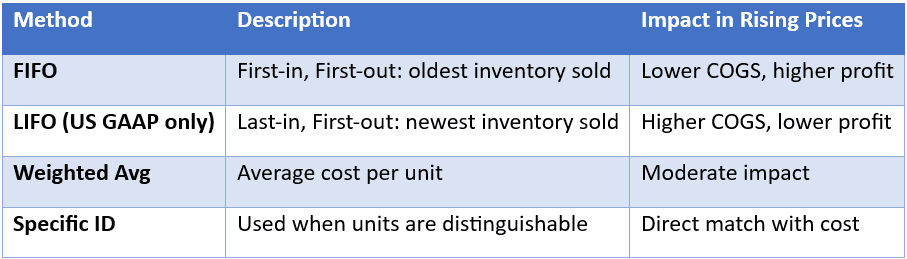
Inventory Accounting Methods
IFRS prohibits LIFO
Inventory’s Financial Statement Impact
Affects COGS, gross profit, net income, taxes, inventory balances, and ratios
Inventory valuation errors distort both income statement and balance sheet
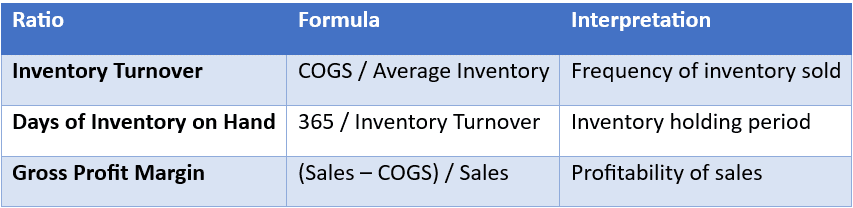
Inventory Ratios
Higher turnover and lower days indicate efficiency, but may also signal stockouts.
LIFO Reserve & Comparability
LIFO Reserve = FIFO Inventory – LIFO Inventory
Used to adjust LIFO firms to FIFO for comparability
FIFO results in higher income during inflationary periods
LIFO Reserve enables cross-firm comparisons
Suggested Practice
Convert LIFO to FIFO using LIFO reserve
Analyze turnover and inventory days across firms
Learning Module 7: Analysis of Long-term Assets
Overview
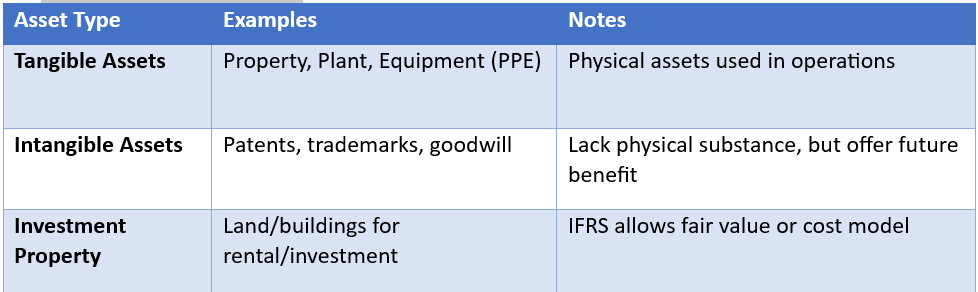
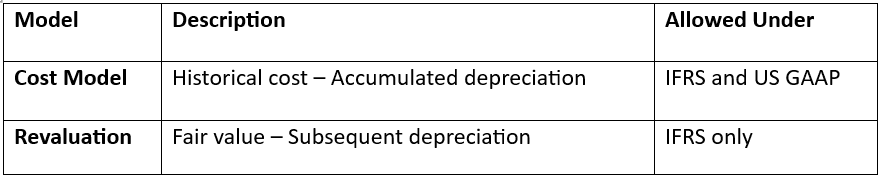
This module covers the accounting and analysis of long-term (non-current) assets, including tangible, intangible, and investment assets. It explores measurement, depreciation, impairment, and revaluation effects on financial statements.
Types of Long-Term Assets
Measurement Models
Depreciation and Amortization
Depreciation: Allocation of cost of tangible assets over useful life
Amortization: Same for intangible assets (excluding indefinite-lived like goodwill)
Common methods:
Straight-Line: Equal expense each period
Declining Balance: Accelerated (higher earlier)
Units of Production: Based on output/use
Impairment of Long-Term Assets
Triggered by decline in asset’s recoverable value
IFRS: Compare carrying amount vs recoverable amount (higher of value in use or fair value – cost to sell)
US GAAP: Compare carrying amount to undiscounted future cash flows
Loss = Carrying amount – Recoverable amount (if impaired)
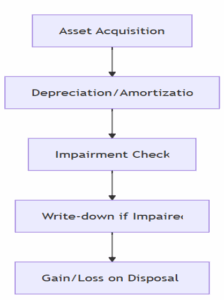
Derecognition
Occurs on sale, disposal, or permanent withdrawal of asset
Gain/Loss = Proceeds – Carrying amount
Visual: Asset Lifecycle and Effects
Impact on Financial Statements
Affects net income, asset values, equity, and ratios
Choice of depreciation method impacts timing of expense recognition
Summary Points
Long-term assets are critical to operations and valuation
IFRS allows more flexibility (revaluation) than US GAAP
Impairments reduce asset values and net income
Analysts adjust for depreciation methods and revaluations in comparisons
Suggested Practice
Compare asset valuation under cost vs revaluation model
Recalculate depreciation using different methods
Analyze impairment effect on profitability and asset turnover
Learning Module 8: Topics in Long-Term Liabilities and Equity
Overview
This module explains the classification, measurement, and analysis of long-term liabilities and equity, including bond issuance, leases, stockholders’ equity, and how these affect capital structure and financial performance.
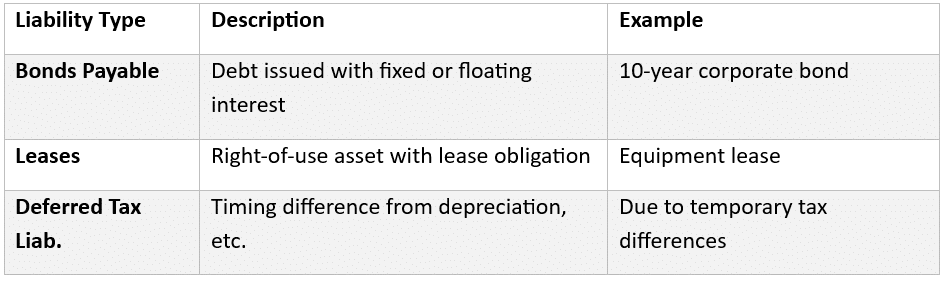
Long-Term Liabilities
Measurement: Recorded at present value of future payments
Lease Accounting
All leases (except short-term or low-value) are capitalized
Recognize Right-of-Use Asset and Lease Liability
Impact:
Higher assets and liabilities
Higher EBITDA (lease expense split into depreciation + interest)
Bonds and Interest Recognition
Bonds can be issued at par, premium, or discount
Interest Expense = Carrying Value × Market Rate
Difference between coupon and interest expense = Amortization of premium/discount
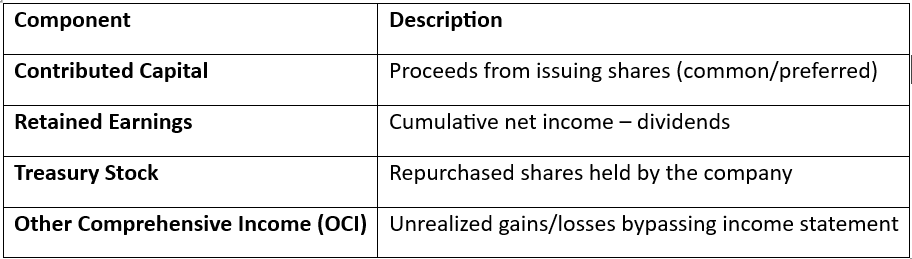
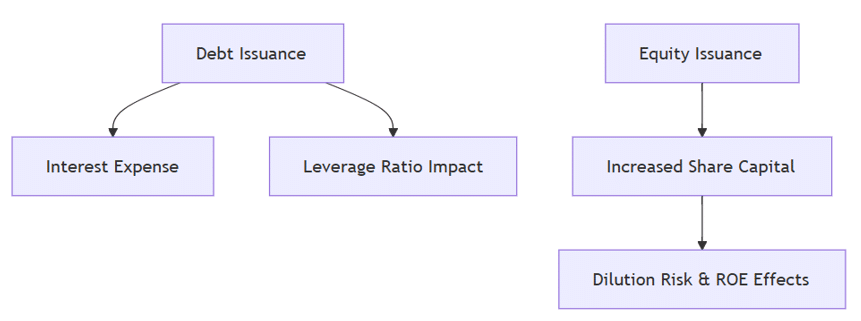
Equity Section Components
Visual: Capital Structure & Effects (Mermaid)
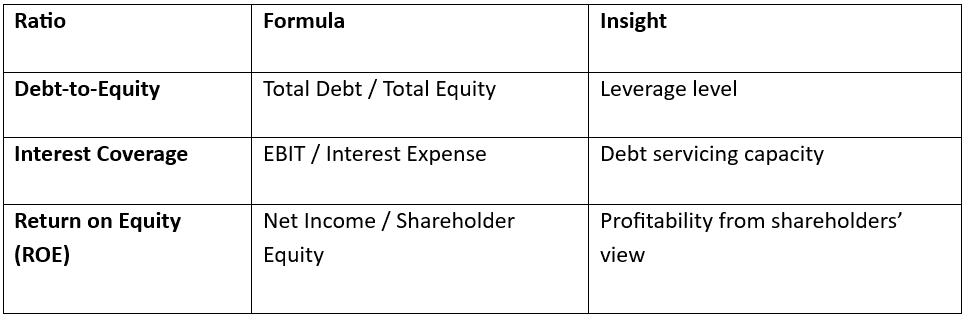
Key Ratios
Summary Points
Long-term liabilities increase leverage but can enhance returns
Leases and bonds impact both income and balance sheet differently
Equity includes both paid-in capital and retained earnings
Analysts track capital structure to assess risk and return
Suggested Practice
Analyze lease vs purchase impact on financials
Adjust ROE for share buybacks and new issuance
Interpret trends in debt and equity funding strategies
Learning Module 9: Analysis of Income Taxes
Overview
This module explains how income tax expense is recognized and analyzed in financial reporting. It focuses on temporary differences, deferred tax assets and liabilities, and their implications for evaluating earnings quality and financial health.
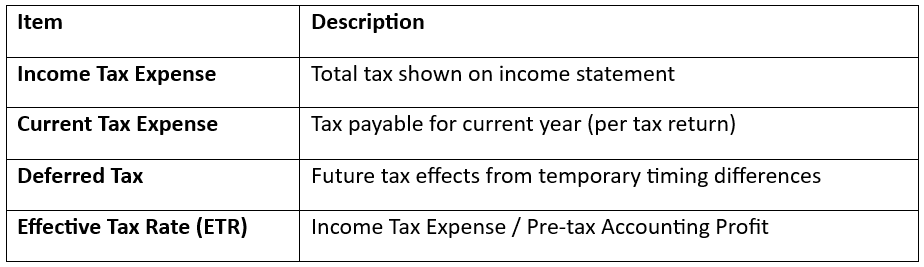
Components of Tax Reporting
Temporary vs. Permanent Differences
Temporary Differences: Cause deferred tax items; reverse over time
Depreciation methods (accounting vs tax)
Warranty expenses, bad debt provisions
Permanent Differences: Do not reverse; affect ETR but not deferred tax
Fines, tax-exempt income
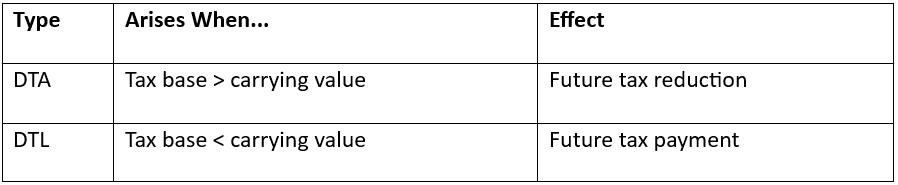
Deferred Tax Assets (DTA) and Liabilities (DTL)
DTA is recognized only if realization is probable
Valuation Allowance (US GAAP)
Applied to reduce DTA if future tax benefit unlikely
Affects net income and signals doubt about profitability
Analytical Implications
Rising DTLs may signal future tax cash outflows
Changes in tax laws affect valuation of deferred tax balances
Analysts adjust for one-time tax effects (e.g., changes in rate, reversals)
Summary Points
Tax expense has current and deferred components
Temporary differences lead to deferred tax items
DTA realization requires future taxable income
ETR analysis reveals discrepancies between accounting and tax reporting
Suggested Practice
Classify tax differences as permanent or temporary
Reconstruct tax expense from DTA/DTL changes
Interpret implications of valuation allowance and ETR movement
Learning Module 10: Financial Reporting Quality
Overview
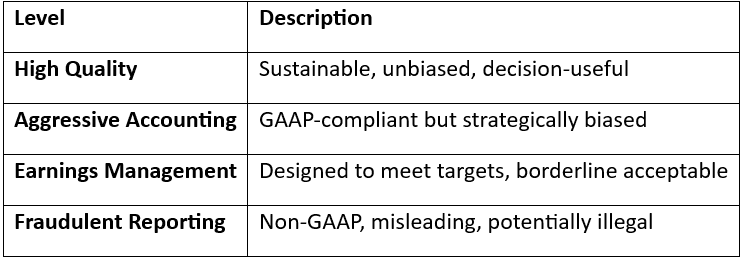
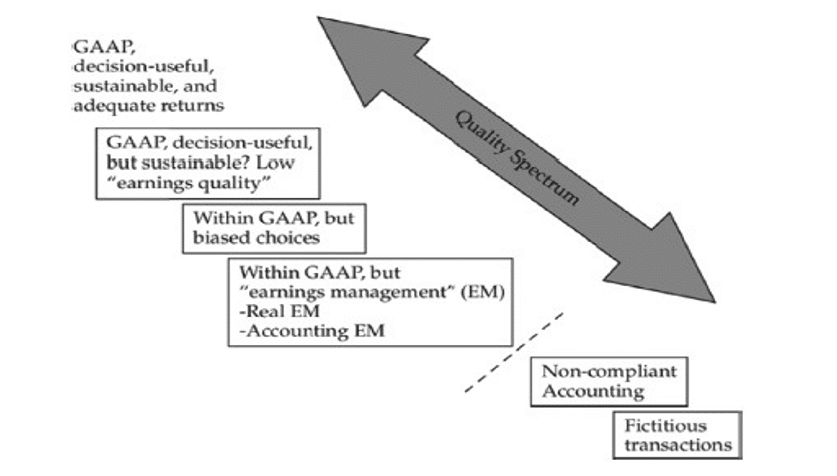
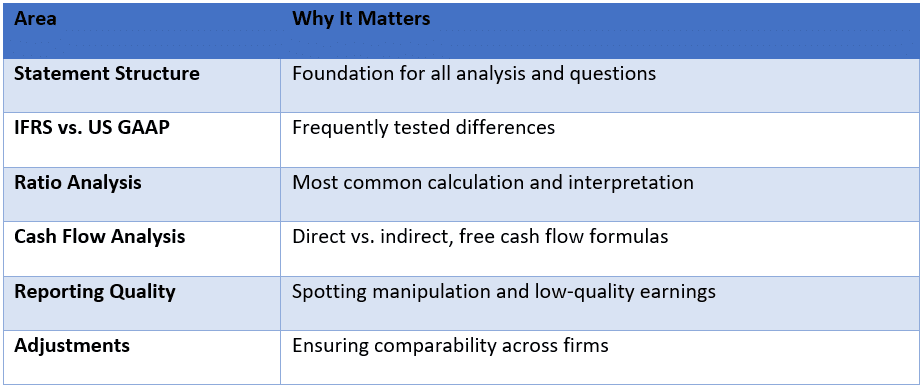
This module explores the concept of financial reporting quality, distinguishing between high- and low-quality reporting, and identifying earnings manipulation techniques that affect decision usefulness.
Two Dimensions of Financial Reporting Quality
Decision-Usefulness: Is the information relevant and faithfully represented?
Earnings Quality: Are reported earnings sustainable and unbiased?
Characteristics of High-Quality Reporting
Transparent: Clear and detailed disclosures
Comprehensive: Includes all material transactions
Consistent: Over time and aligned with economic reality
Low-quality reporting distorts financial position and performance
Analysts use consistency, transparency, and earnings persistence to evaluate quality
Suggested Practice
Identify red flags in sample income statements
Analyze cash flow vs net income to detect manipulation
Rank earnings quality across peer companies using real disclosures
Learning Module 11: Financial Analysis Techniques
Overview
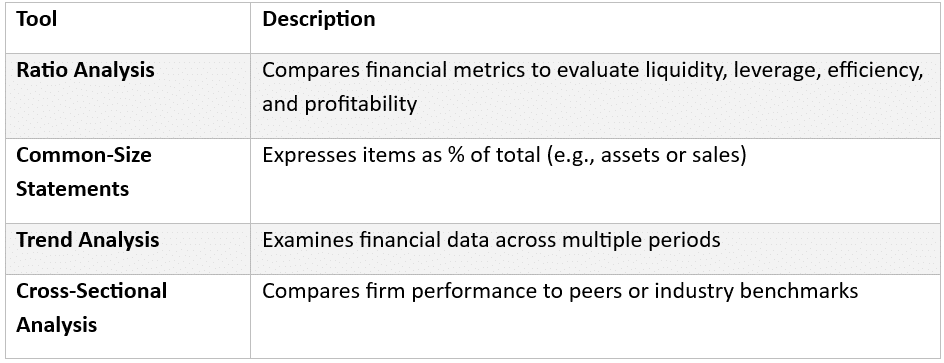
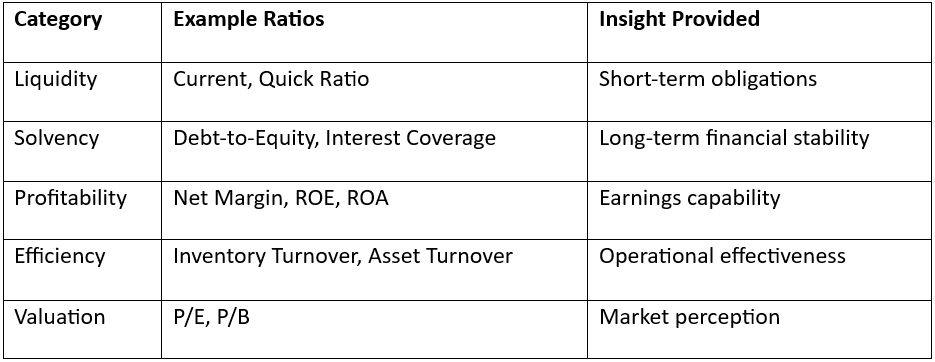
This module outlines key tools and techniques used to analyze financial statements. It includes ratio analysis, common-size and trend analysis, and how these help evaluate performance, risk, and financial health.
Ratios affected by seasonality, inflation, or timing differences
Interpretation requires context and comparison
Summary Points
Financial analysis evaluates performance and risk using structured tools
Ratio and common-size analysis provide insights into business health
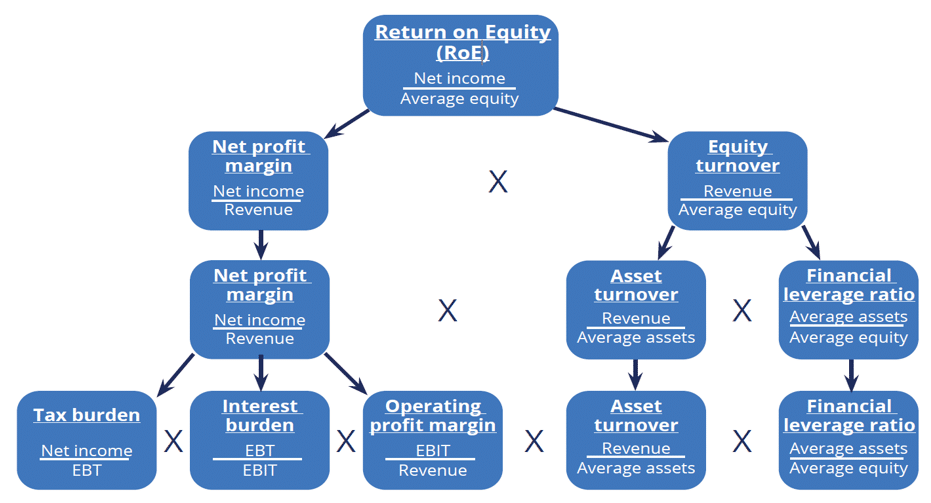
DuPont breaks down ROE into actionable drivers
Suggested Practice
Decompose ROE for 3 companies using DuPont
Compare trend and common-size statements across years
Evaluate peer group financial ratios and identify outliers
Learning Module 12: Introduction to Financial Statement Modeling
Overview
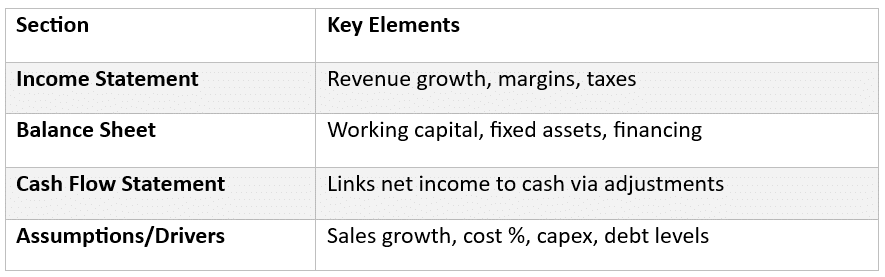
This module introduces the basics of financial modeling, focusing on how financial statements can be forecasted and linked to estimate a company’s future performance using assumptions and historical data.
Purpose of Financial Modeling
Project future income, cash flow, and balance sheet items
Support valuation, budgeting, and decision-making
Evaluate impact of strategic or macro assumptions on financials