Goal: Assess current strength and identify factors affecting near-term performance.
Why Both Matter
Historical analysis reveals trends and stability, while present analysis shows current viability and risks.
Combined, they help estimate future cash flows and value, critical for valuation models (like DCF, FCF, or multiples).
6.Industry and Competitive Analysis
Industry classification helps investors and analysts group companies based on their business activities to analyze performance, risks, and trends for portfolio decisions.
Used by index providers and portfolio managers for benchmarking.
Statistical Systems:
Examples: NAICS (North American Industry Classification System), SIC (Standard Industrial Classification).
Used by governments and regulators for economic data.
Sector vs. Industry Levels:
Sectors are broad categories (e.g., Energy, Financials).
Industries are narrower groupings (e.g., Banks, Oil & Gas).
Use in Competitive Analysis:
Helps assess industry growth prospects, risk exposures, and competitive forces (Porter’s Five Forces).
Essential for top-down portfolio strategies and relative valuation.
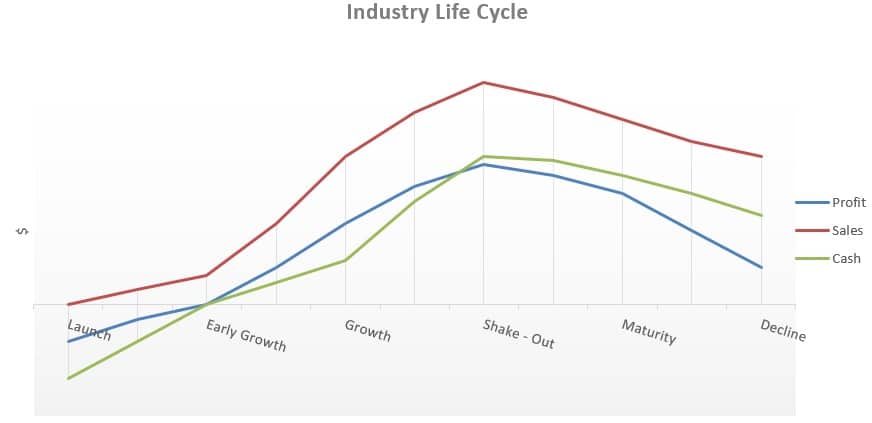
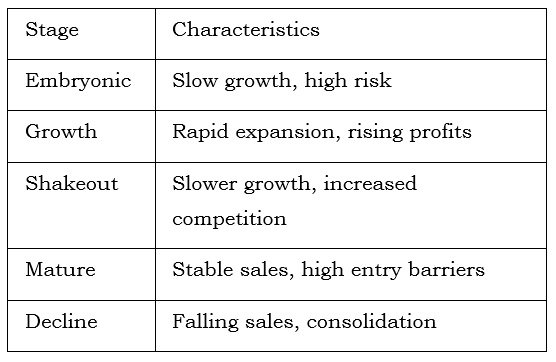
Industry Life Cycle
Porter’s Five Forces
Threat of New Entrants: Risk that new competitors can easily enter the market and reduce profitability.
Bargaining Power of Suppliers: Ability of suppliers to raise costs or reduce quality, squeezing margins.
Bargaining Power of Buyers: Power of customers to demand lower prices or better terms.
Threat of Substitutes: Risk of alternative products/services reducing demand.
Industry Rivalry: Intensity of competition among existing firms, driving down prices and profits.
Company Analysis: Forecasting
Forecasting Inputs
When analyzing a company for valuation, analysts forecast future performance by using three main categories of inputs:
Macroeconomic Inputs
GDP growth, inflation, interest rates, currency trends.
Helps estimate the overall economic environment affecting revenue and costs.
Industry Inputs
Industry growth rates, competitive dynamics (Porter’s Five Forces), regulatory changes, pricing trends.
Provides context for market share and pricing power assumptions.
Company-Specific Inputs
Historical financial data, revenue drivers (volume & price), cost structure, capital expenditures, working capital needs, tax rates, financing structure.
Used to build projections for revenue, expenses, and cash flows.
Revenue Drivers: Units sold, price per unit.
Cost Structure: Fixed vs. variable costs.
Margins: Gross, operating, net profit margins.
Growth Assumptions: Based on historical data, industry trends, macroeconomic factors.
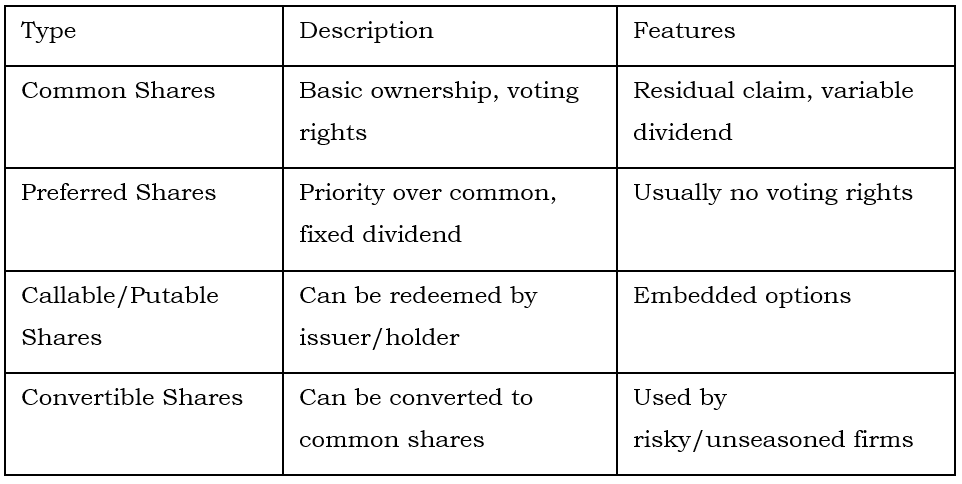
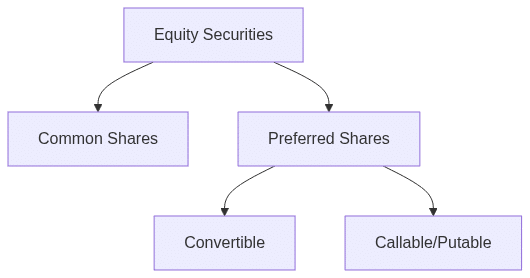
8.Equity Valuation: Concepts and Basic Tools
Valuation Approaches
1. Discounted Cash Flow (DCF) Models
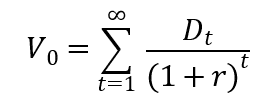
Dividend Discount Model (DDM):
Where Dt = dividend at time t ,r = required return.
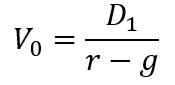
Gordon Growth Model (Constant Growth DDM):
Where D1 = next year’s dividend, g = growth rate
Worked Example: Gordon Growth Model
Suppose a stock pays a $2 dividend next year, required return is 8%, and growth rate is 3%.
V0 = 2 / (0.08 – 0.03) = $40
Free Cash Flow Models
These models value a company by discounting its future free cash flows (cash available to investors) at an appropriate discount rate.
Free Cash Flow to Firm (FCFF):
Cash flow available to all capital providers (debt + equity).
FCFF = Net Income + NCC + [Int × (1 − tax rate)] − FCInv – WCInv
NCC = Non Cash Charges (Depreciation and Amortization)
Int = cash interest paid
FCInv = fixed capital investment (net capital expenditures)
WCInv = working capital investment
FCFE (Free Cash Flow to Equity):
Cash flow available only to equity shareholders after debt obligations.
FCFE = Net Income + Depreciation – CapEx – working Capital + Net Borrowing
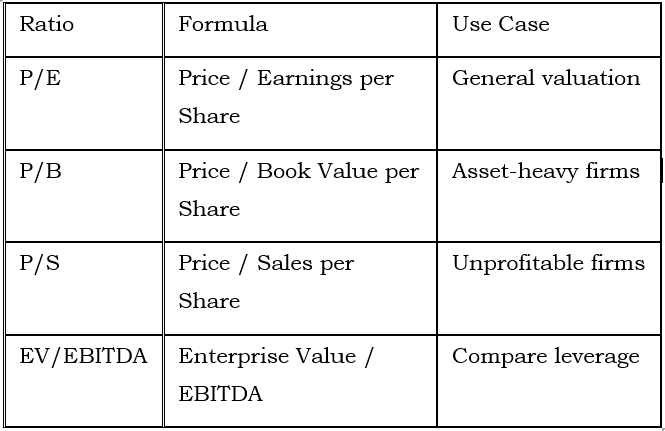
Multiplier (Relative) Models
Asset-Based Models
These models value a company by estimating the market or fair value of its assets minus its liabilities.
Value based on net asset value (assets – liabilities).
Types:
Book Value Approach: Uses balance sheet values (less common for valuation).
Adjusted Net Asset Value: Adjusts assets and liabilities to fair market value (common in practice).
Best Use Cases:
Firms with tangible, liquid assets (e.g., REITs, natural resource firms).
Liquidation scenarios or valuing holding companies.
3. Limitation:
Less effective for companies with intangible assets or strong earnings power (e.g., tech firms).
Enterprise Value
Enterprise Value (EV) represents the total value of a company, considering both equity and debt holders. It is often viewed as the theoretical takeover price because it accounts for all sources of capital.
EV = Market Cap + debt – Cash
Why EV Matters (vs Market Cap)
Market Capitalization only measures equity value and ignores debt.
EV adjusts for capital structure, making it better for comparing companies with different debt levels.
Example:
A company has:
Market Cap = ₹500 crore
Debt = ₹200 crore
Cash = ₹50 crore
EV=500+200−50=₹650crore
This means an acquirer would effectively pay ₹650 crore to buy the company (equity + debt payoff, minus cash).
Cost of Equity (CAPM) Formula
The Capital Asset Pricing Model (CAPM) estimates a company’s cost of equity based on risk and return:
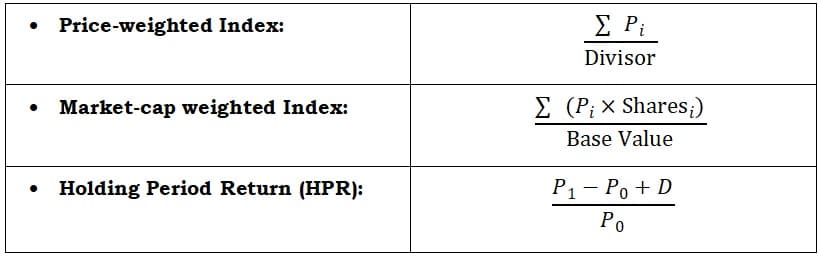
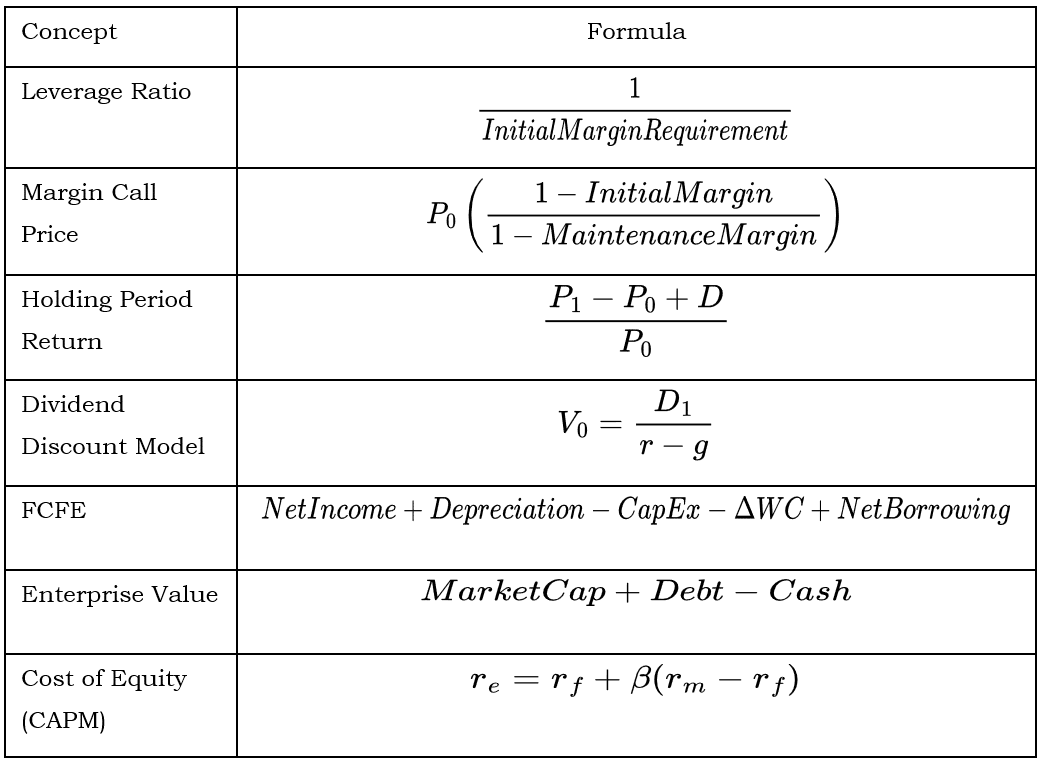
9. Key Formulae Summary Table
10. Exam Tips & Application
Focus on Concepts: Most questions are qualitative, testing your understanding of equity as an asset class, market structure, and valuation models.
Practice Calculations: Especially for DDM, FCFE, and index returns.
Know When to Use Each Valuation Model:
DDM for stable, dividend-paying firms.
FCFE for firms with unpredictable dividends.
Multiples for quick relative valuation.
Asset-based for firms with tangible assets or in liquidation.
Interpretation Over Memorization: Understand what the numbers mean and how to apply them.
Behavioral Finance: Be aware of common biases that can affect market efficiency.