Learning Module 1 – The Firm and Market Structures
Overview
This module introduces different types of market structures and how firms operate and compete within them. It emphasizes pricing power, efficiency, and long-run outcomes across perfect competition, monopolistic competition, oligopoly, and monopoly.
Types of Market Structures
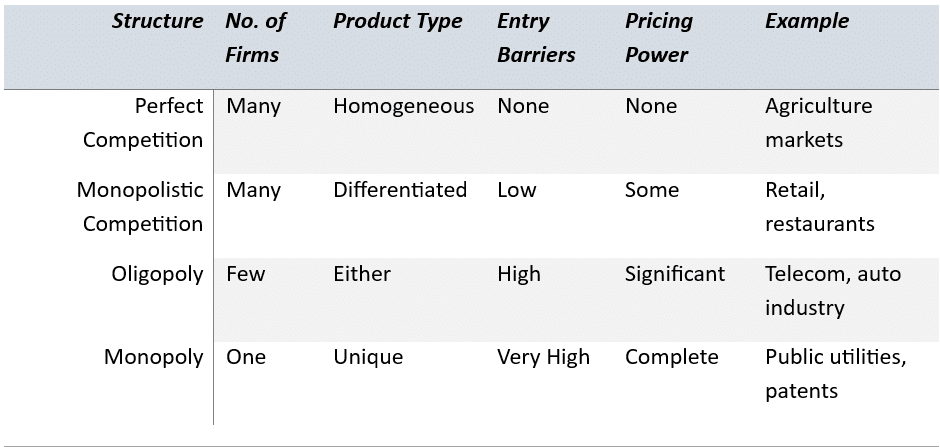
Revenue and Pricing Dynamics
- Perfect Competition: P = MR = AR (firm is price taker)
- Monopoly/Oligopoly: MR < P due to downward-sloping demand
- Profit Maximization Rule: All firms produce where MR = MC
Efficiency Comparison
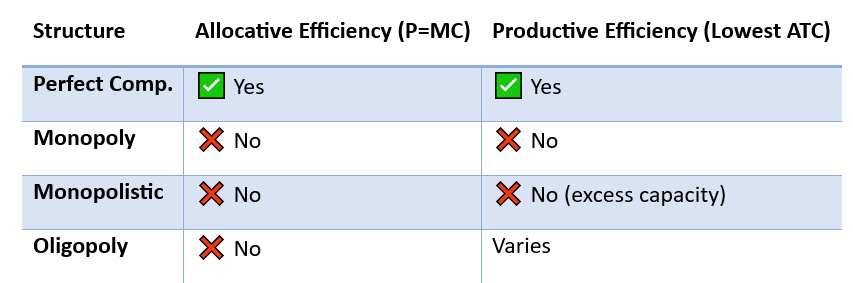
Long-Run Outcomes
- Perfect & Monopolistic Competition: Zero economic profit in long run
- Oligopoly & Monopoly: May sustain long-run profits due to barriers
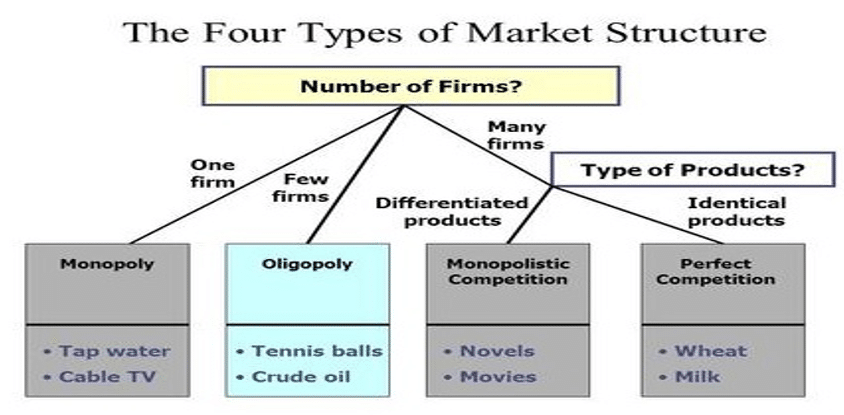
Visual: Market Structure Continuum
Additional Concepts
- Concentration Ratios (CRn): % of output by top n firms → higher = less competition
- Herfindahl–Hirschman Index (HHI): Sum of squared market shares → used in merger regulation
- Game Theory in Oligopoly: Strategic interaction like collusion, price wars
Summary Points
- Market structure influences pricing, profits, efficiency, and strategy
- Perfect competition = no pricing power; Monopoly = total pricing power
- Long-run profit depends on entry barriers
Suggested Practice
- Compare MR and MC graphs under different structures
- Classify real-world industries by structure
- Calculate HHI from given market shares
Learning Module 2 – Understanding Business Cycles
Overview
This module explores the phases of business cycles, key macroeconomic indicators, and their implications for economic forecasting and investment decisions.
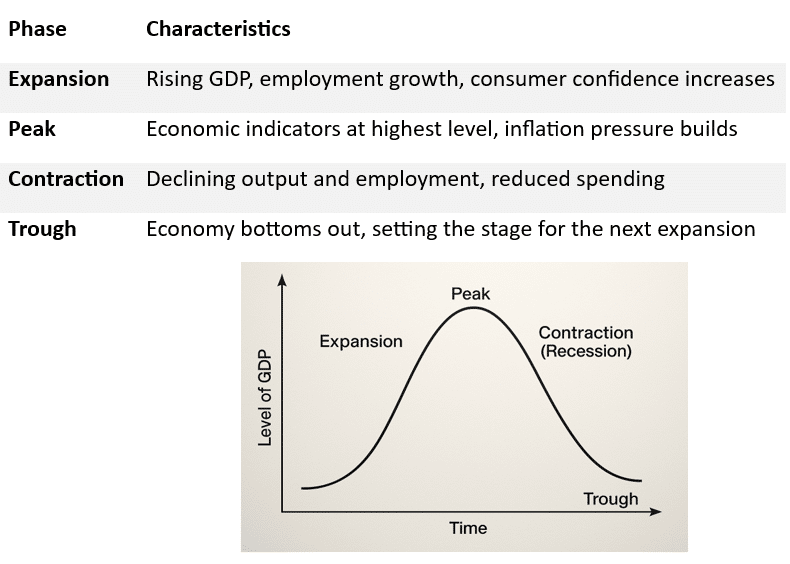
Business Cycle Phases
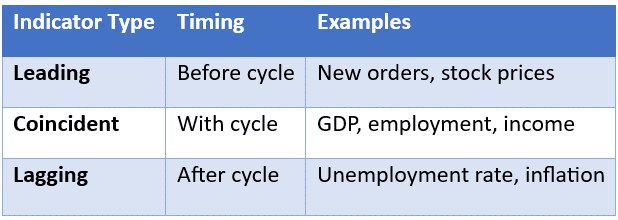
Time Lag of Economic Indicators
Key Macroeconomic Indicators
- GDP Growth – Most comprehensive coincident indicator.
- Unemployment Rate – Lagging, reflects past economic conditions.
- Inflation (CPI, PPI) – Typically lags but can signal overheating.
- Interest Rates – Set by central banks to manage cycles.
- Consumer Confidence & Business Inventories – Often leading indicators
Global Considerations
- Business cycles are not synchronized across countries.
- Global trade and capital flows can transmit cycles internationally.
- Emerging markets may have more volatile cycles due to reliance on commodities.
Role of Central Banks
- Use monetary policy (interest rate, reserve requirements, QE) to smooth cycles.
- Respond more actively during contractions with stimulus measures.
- May tighten policy during expansions to curb inflation.
Real vs. Nominal Variables
- Real variables are inflation-adjusted (e.g., real GDP).
- Nominal variables include inflation and can overstate growth during inflationary periods.
Summary Points
- Business cycles are recurrent but not periodic.
- Key indicators provide signals about the economy’s current and future direction.
- Policy responses differ depending on phase and indicator signals.
Suggested Practice
- Identify current business cycle phase using real-world data.
- Match indicators to their category (leading, coincident, lagging).
- Understand central bank responses under various cycle phases.
Learning Module 3 – Fiscal Policy
Overview
Fiscal policy refers to the government’s use of taxation and spending to influence the economy. This module examines objectives, tools, types of fiscal policy, and challenges associated with its implementation.
Objectives of Fiscal Policy
- Economic Stabilization: Counter cyclical swings in output and employment.
- Resource Allocation: Government spending to guide production and services.
- Income Redistribution: Taxes and social programs to address inequality.
Tools of Fiscal Policy
- Government Spending: On infrastructure, defense, education, etc.
- Taxation: Direct (income tax) and indirect (VAT, excise duty).
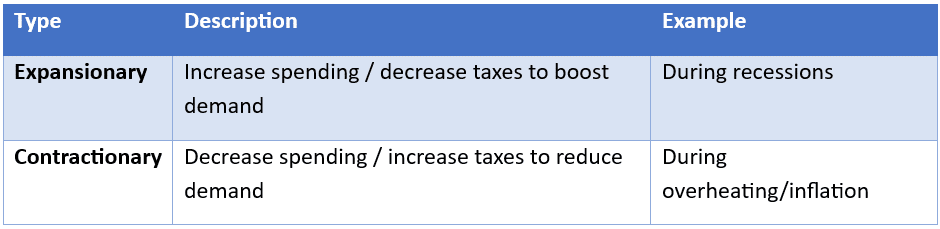
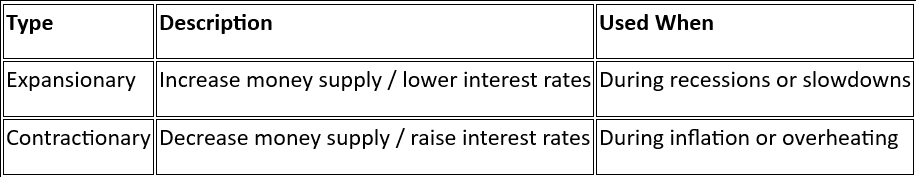
Types of Fiscal Policy
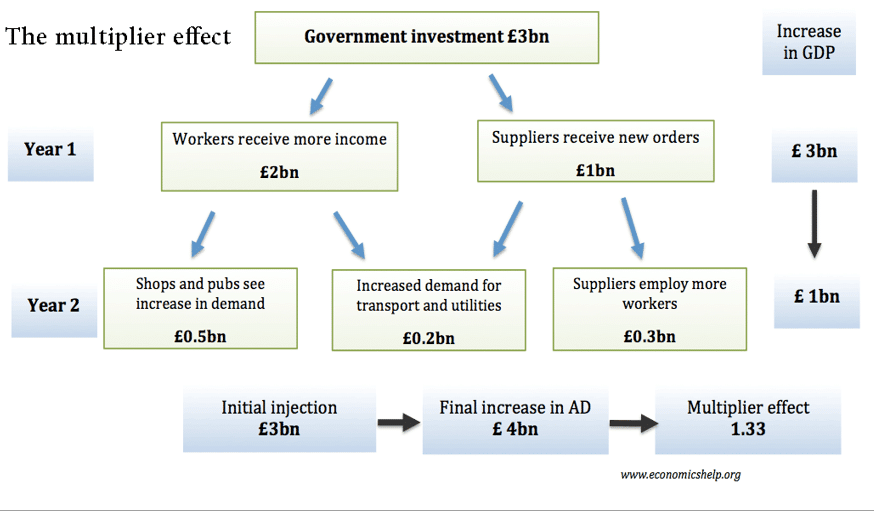
Fiscal Multiplier Effect
Describes the change in GDP resulting from a change in fiscal spending or taxes.
Formula:
Multiplier = 1 / (1 – MPC), Where MPC = Marginal Propensity to Consume
Challenges of Fiscal Policy
- Crowding Out: Govt borrowing raises interest rates, reducing private investment.
- Time Lags: Recognition, decision, and implementation delays.
- Political Constraints: Policy changes may not be economically optimal.
- Ricardian Equivalence: Consumers may save more expecting future tax hikes.
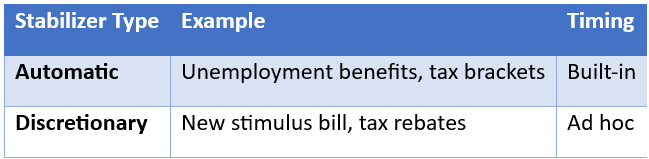
Automatic vs Discretionary Stabilizers
Budget Deficit and Public Debt
- Deficit: Spending > Revenues in a fiscal year.
- Debt: Accumulated deficits over time.
- Sustained high deficits can increase debt-to-GDP ratio.
Summary Points
- Fiscal policy aims at stabilization, allocation, and redistribution.
- Tools: Govt spending and taxation.
- Expansionary policy is used in recessions; contractionary in inflation.
- Multiplier effect magnifies impact of fiscal actions.
- Implementation is often constrained by time lags and politics.
Suggested Practice
- Calculate multiplier given MPC.
- Analyze scenarios where fiscal policy may be ineffective.
- Identify automatic vs discretionary stabilizers in real-world situations.
Learning Module 4 – Monetary Policy
Overview
Monetary policy involves the central bank’s use of tools to influence money supply, interest rates, inflation, and overall economic activity. This module explores the goals, transmission mechanisms, tools, types, and limitations of monetary policy.
Objectives of Monetary Policy
- Price Stability: Control inflation and maintain purchasing power.
- Economic Growth: Support sustainable output and employment.
- Full Employment: Minimize unemployment without triggering inflation.
- Exchange Rate Stability: Particularly in open economies.
Tools of Monetary Policy
- Open Market Operations (OMO): Buying/selling government securities.
- Policy Rates: Repo rate, discount rate adjustments.
- Reserve Requirements: Ratio banks must hold in reserve.
- Forward Guidance: Communicating future policy intentions.
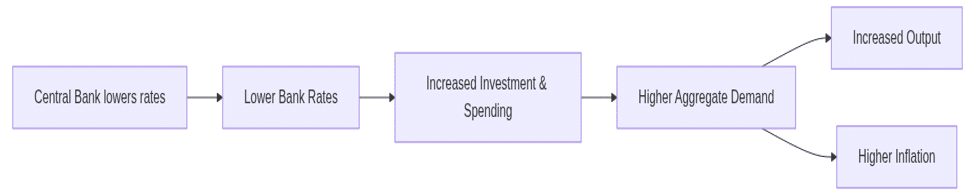
Monetary Policy Transmission Mechanism
How central bank actions affect aggregate demand and inflation.
Transfer mechanism:
Time Lags
- Inside Lag: Delay in recognizing problem and implementing policy.
- Outside Lag: Delay between implementation and observable effects.
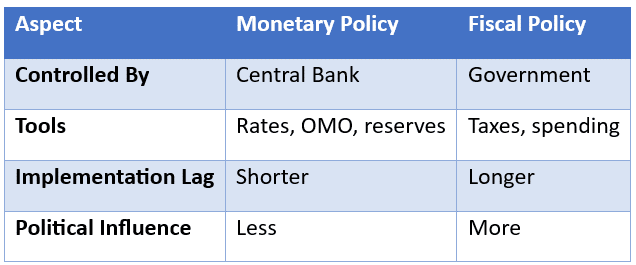
Monetary vs Fiscal Policy
Inflation Targeting
- Central banks set explicit inflation targets (e.g., 2%)
- Builds credibility, predictability, and transparency
- Anchors expectations and improves long-term planning
Limitations of Monetary Policy
- Liquidity Trap: Very low rates fail to stimulate demand
- Time Lags reduce effectiveness
- Global Spillovers: Cross-border capital flows may dilute domestic impact
Summary Points
- Goals: price stability, economic growth, employment, stable currency
- Tools: policy rates, OMOs, reserve ratio, guidance
- Expansionary = rate cuts; Contractionary = rate hikes
- Policy works via transmission to consumption, investment, inflation
Suggested Practice
- Compare monetary tools across economies
- Trace impact of rate changes using transmission flow
- Evaluate effectiveness in real-world low-interest environments
Learning Module 5 – Introduction to
Geopolitics
Overview
This module explores how geopolitical factors influence economic activity, financial markets, and investment decisions. Understanding these dynamics helps analysts assess country-level risks and opportunities.
Definition of Geopolitics
Geopolitics refers to the study of how geographic, political, economic, and strategic factors influence the behavior of nations and international relations.
Core Elements of Geopolitical Analysis
- Geography: Natural resources, access to trade routes, neighbors
- Politics: Government stability, political ideologies, policy direction
- Military Power: Defense spending, global positioning, alliances
- Economic Capabilities: GDP size, trade balance, energy independence
- Institutional Strength: Legal systems, regulatory environment
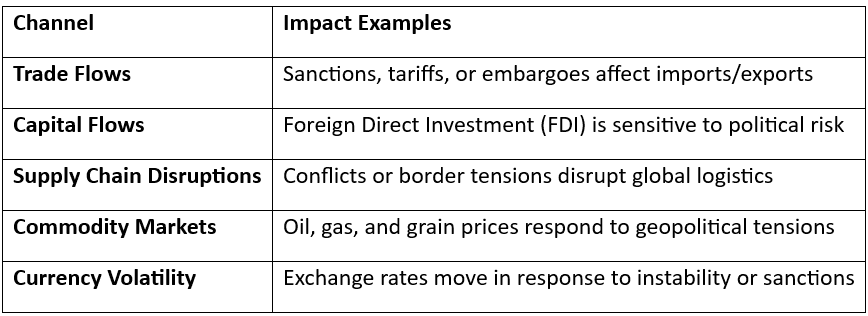
Economic Channels Affected by Geopolitics
Geopolitical Risk and Investment Decisions
- Country risk assessments include political stability, policy consistency, legal predictability
- Geopolitical uncertainty increases risk premiums and market volatility
- Diversification across regions can mitigate specific geopolitical risks
Tools to Analyze and Mitigate Geopolitical Risk
- Country Risk Ratings (e.g., S&P, Moody’s)
- Geopolitical Risk Index (GPR) – Measures frequency of newspaper coverage of tensions
- Scenario Analysis – Simulate outcomes based on different geopolitical developments
- Hedging Strategies – Currency hedges, commodity derivatives
Historical Case Examples
- Russia-Ukraine Conflict: Oil, gas, and wheat price surges; sanctions disrupt banking systems
- US-China Trade War: Tariff impacts on tech and agriculture; supply chain reconfiguration
- Brexit: Regulatory uncertainty and capital flight from the UK
Visual: Geopolitical Risk Influence Map
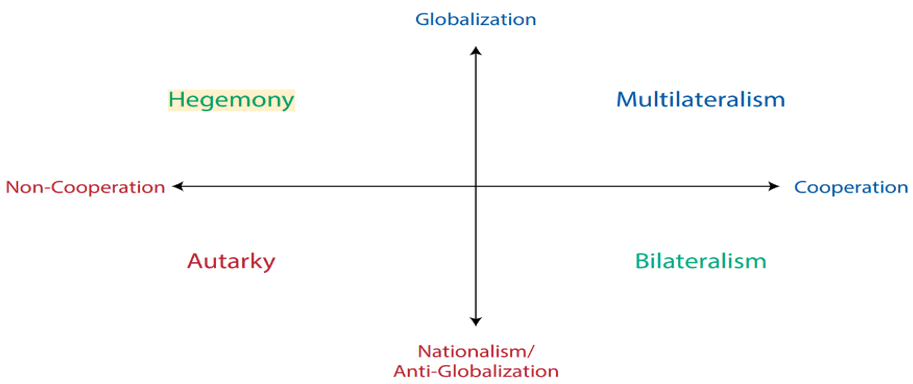
Summary Points
- Geopolitics shapes trade, capital flows, and investor sentiment
- Key risks: instability, war, sanctions, policy shifts
- Investors can mitigate risk via diversification and hedging
- Analysts use both quantitative and qualitative tools to assess geopolitical exposure
Suggested Practice
- Track a current geopolitical event and map its financial impact
- Compare risk ratings of multiple countries
- Use scenario analysis to forecast asset behavior in response to rising tensions
Learning Module 6 – International Trade
Overview
This module introduces key principles of international trade, the benefits and costs of trade, trade restrictions, and how trade policies affect economic outcomes. It also explores how countries specialize based on comparative advantage.
Key Concepts
- Absolute Advantage: When a country can produce a good using fewer resources than another.
- Comparative Advantage: When a country can produce a good at a lower opportunity cost.
- Gains from Trade: Arise when countries specialize and exchange based on comparative advantage.
Types of Trade Restrictions
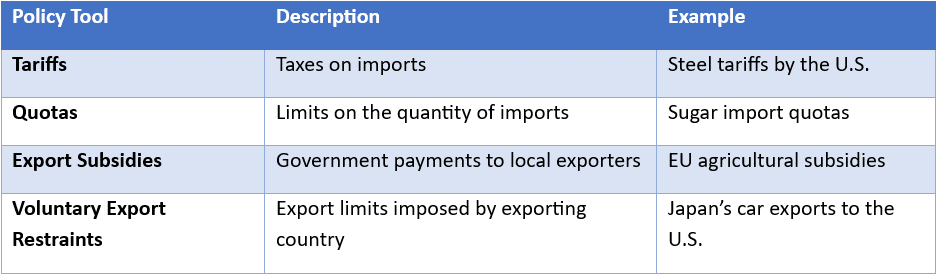
Economic Effects of Trade Restrictions
- Consumer Surplus Falls: Higher prices and less choice
- Producer Surplus Rises: Domestic firms gain market share
- Deadweight Loss: Overall economic inefficiency
- Retaliation Risk: May trigger trade wars
Trade Agreements and Organizations
- WTO (World Trade Organization): Promotes free trade and settles disputes
- FTA (Free Trade Agreement): Reduces/eliminates tariffs between countries
- Customs Union: Common external tariffs + free trade within bloc
- Common Market: Customs union + free movement of factors of production
Balance of Payments (BoP)
Records all economic transactions between residents of a country and the rest of the world.
Main Components:
- Current Account: Goods, services, income, transfers
- Capital Account: Transfers of capital assets
- Financial Account: Investments, reserves, loans
Trade Deficits vs Surpluses
- Trade Deficit: Imports > Exports → Currency depreciation pressure
- Trade Surplus: Exports > Imports → Currency appreciation pressure
Summary Points
- Comparative advantage drives specialization and trade
- Restrictions distort market outcomes and reduce global welfare
- BoP tracks economic flows between nations
- Trade policies have domestic winners and losers
Suggested Practice
- Identify winners and losers from a new trade restriction
- Analyze impact of tariff using supply/demand diagrams
- Understand BoP structure and interpret current account trends
Learning Module 7 – Capital Flows and Foreign Exchange Markets
Overview
This module explores how capital flows and foreign exchange (FX) markets operate. It covers currency markets, exchange rate systems, and the impact of capital mobility and currency regimes on macroeconomic stability.
Key Concepts
- Capital Flows: Movement of funds across borders for investment (FDI, portfolio flows, loans)
- Foreign Exchange Market: Global decentralized market for currency exchange
- Exchange Rate: Price of one currency in terms of another
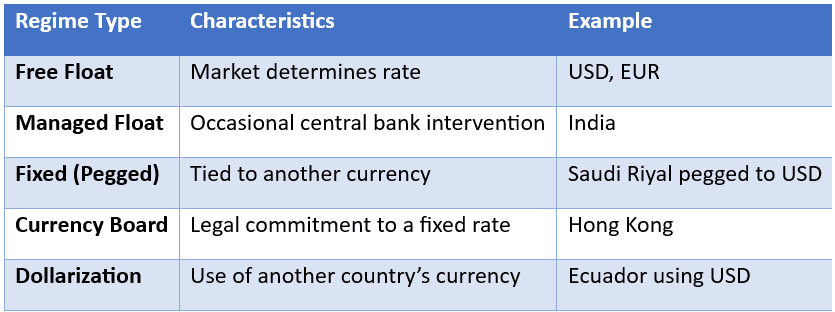
Types of Exchange Rate Regimes
Capital Controls
- Administrative Tools used to limit capital movement
- May include restrictions on FDI, taxes on capital flows, or quantitative limits
- Aimed at managing exchange rate volatility, financial stability
Impact of Capital Flows
- Positive: Brings foreign investment, improves productivity
- Negative: Sudden stops or reversals can lead to crises
- Volatile Capital Flows can disrupt exchange rate and monetary stability
FX Market Features
- Major Participants: Central banks, commercial banks, hedge funds, corporations
- Instruments: Spot, forward, swap, options
- Market is OTC: Decentralized and operates 24/7 globally
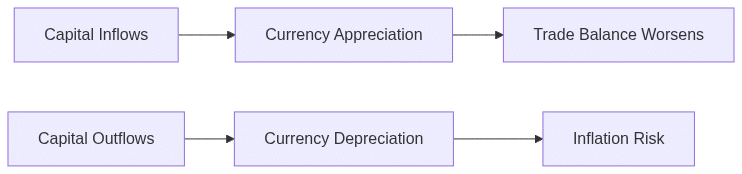
Currency Appreciation vs Depreciation
- Appreciation: Currency value rises → Imports cheaper, exports hurt
- Depreciation: Currency value falls → Exports benefit, inflation risk rises
Visual: Capital Flow and FX Rate Influence
Summary Points
- FX markets are critical for global trade and investment
- Exchange rate regimes vary by country’s macro priorities
- Capital flows offer benefits but also pose systemic risks
- Central banks intervene to stabilize currency and protect reserves
Suggested Practice
- Differentiate between FX regimes using real-world cases
- Analyze effects of capital inflow surge on currency and inflation
- Interpret forward rates and spot FX transactions
Learning Module 8 – Exchange Rate Calculations
Overview
This module focuses on how exchange rates are quoted and calculated, and how to perform currency conversions and cross-rate calculations. It also introduces the concept of bid–ask spreads and forward rates.
Exchange Rate Quotations
- Direct Quote: Home currency per unit of foreign currency (e.g., INR 80/USD)
- Indirect Quote: Foreign currency per unit of home currency (e.g., USD 0.0125/INR)
- Base Currency: The currency being bought or sold (e.g., USD in INR/USD)
- Price Currency: The currency in which the quote is expressed
Currency Conversion Formula
Price in Home Currency = Price in Foreign Currency × Exchange Rate
Example:
100 USD × 80 INR/USD = ₹8,000
Cross Rate Calculations
Used when direct quote is not available. Calculate using common base:
Currency A / Currency C = (Currency A / Currency B) × (Currency B / Currency C)
Example:
EUR/JPY = EUR/USD × USD/JPY
Bid–Ask Spread
- Bid: Price dealer is willing to pay
- Ask: Price dealer is willing to sell
- Spread: Ask – Bid (profit for dealer)
Formula (in % terms):
Bid–Ask Spread % = [(Ask – Bid) / Ask] × 100
Forward Exchange Rates
- Agreed today, exchanged in future
- Quoted as premium/discount over spot
- Helps hedge FX risk in future transactions
Forward Premium/Discount Formula:
Forward Premium (%) = [(Forward – Spot) / Spot] × (360 / Days) × 100
Summary Points
- Understand quote formats (direct vs indirect)
- Perform conversions and cross-rate calculations
- Interpret bid–ask spreads and compute % spread
- Know how forward rates are used and calculated
Suggested Practice
- Convert using direct and indirect quotes
- Solve cross-rate problems
- Calculate bid–ask spreads and forward premiums